Following on from the price-to-sales ratio (PSR), we move on to the enterprise value-to-sales ratio (EVS). It is similar but takes the balance sheet into consideration.
Imagine a business with £10m in sales. On a PSR of 1x, it is worth £10 million. Now bring in the balance sheet. If the company had no cash or assets, it would still be worth £10m. If it had £5 million in cash and assets, it would become worth £15 million. Conversely, if it had £5 million in debt, it would become worth $5m. If you are confused, swap the company for a house. One has cash in the attic, and the other has a mortgage.
Under B, a buyer would get the cash, which would reduce their purchase price. Under C, they would get the debt which would increase their purchase price. EVS provides more information than PSR, so I prefer it. I have them side by side in my company valuation spreadsheet so I can see the state of the balance sheet at a glance. I will go through some examples.
Severn Trent
Severn Trent (SVT) is a UK-based water company. I plot the sales (blue) and the market cap (green). Sales are £2.4 bn, and the market cap is £8.2 bn. The PSR (black) is 3.2x, having risen from 1.5x in 2005. The valuation, i.e. the amount investors are prepared to pay for SVT’s sales, has doubled according to PSR.
Severn Trent Price-to-Sales Ratio
Looking at enterprise value (EV), SVT has £1 bn of cash and £8.8 bn of debt, making the EV £16 bn. This is similar to option C in the example above because a buyer would have to assume the debt. For SVT, the EVS is twice the PSR.
Severn Trent Enterprise Value-to-Sales Ratio
Next, I put the PSR alongside EVS and show the net debt below, which has more than doubled over the period from £3 bn to £7.3 bn. This explains why the EVS is twice the value of the PSR. Had SVT been debt-free, the PSR and the EVS would have been the same.
Severn Trent Enterprise Value-to-Sales, Price-to-Sales and Debt
Dassault Aviation
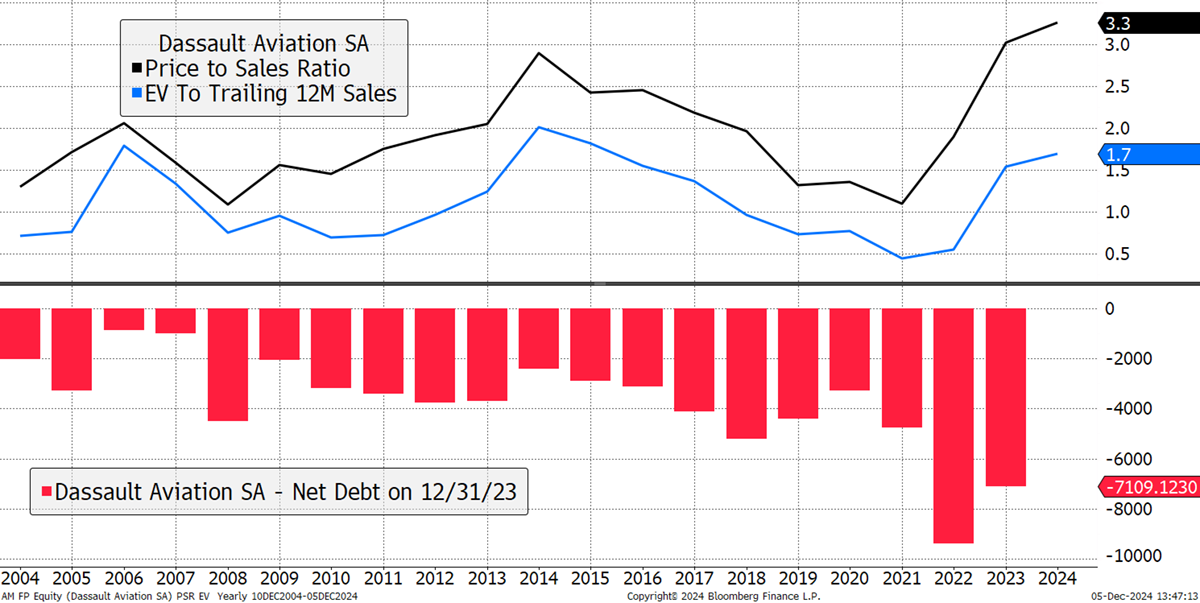
I now move to an example similar to option B, where the company is not only debt-free but also sits on a cash pile. Dassault Aviation (AM France) has sales of €6 bn (not shown), with no debt and a cash balance of around €7.3 bn. The market cap is €15.2 bn, and the enterprise value is €6.6 bn. A buyer of the company would have to pay the market cap but then receive the cash, making it cheaper than it appears. As a result, the EVS is half the level of the PSR.
Dassault Aviation Enterprise Value-to-Sales, Price-to-Sales and Debt
There are not many companies where the EVS is much less than the PSR, or EV is less than the market cap, as it is normally the other way around because most companies carry debt and return excess cash to shareholders via dividends and buybacks. AM is a very conservative investment in contrast to SVT because it has a much stronger balance sheet. Of course, there is nothing wrong with appropriate levels of debt, but things can go wrong, as a fellow UK water company, Thames Water, found out. Examples of other companies with EVs much higher than their PSR include:
Walgreens Boots Alliance
Before 2010, Walgreens Boots Alliance (WBA) had a strong balance sheet as debt was low. Then, the company borrowed heavily to buy back shares in the hope of boosting the share price. As competition from the internet grew, margins came under pressure, and the company soon became over-indebted, and the share price fell. Having once been creditworthy, today, it is distressed, and the company is fighting to pay down debt.
Walgreens Boots Alliance Enterprise Value-to-Sales, Price-to-Sales and Debt
In this case, both the PSR and the EVS are low, but the company isn’t cheap unless they can restore their margins and pay down debt. It is a case study of how debt-funded buybacks can totally destroy shareholder value.
At the other end of the spectrum, we have other companies, like Dassault Aviation, that have strong balance sheets where the PSR is higher than the EVS. This means the balance sheet has more cash than debt.
Centrica
CNA has a net cash balance of £2.3 bn, having been £6 bn in debt in 2014. The company went through an experience similar to WBA, and the shares fell by 90%. Since their low in 2020, the shares have rallied 250%.
We captured some of that in The Multi-Asset Investor, where it was added to the Whisky portfolio in July 2022. I saw that things were turning as the price momentum picked up. Notice how net debt turned negative, meaning the company had a surplus cash balance.
Centrica Enterprise Value-to-Sales, Price-to-Sales and Debt
I could also see that the EVS traded at 0.2, which was unusually low, having averaged 0.65 for 20 years. It is still low to this day, but as I showed with WBA, if the balance sheet is in good health and profitability is improving, a low EVS signal like this can be very profitable.
Centrica Enterprise Value-to-Sales Ratio
A low EVS compared to its history tells you that investors have lost faith in the company and are willing to pay less for their sales. In the case of WBA, they were right, but in the case of CNA, they were wrong.
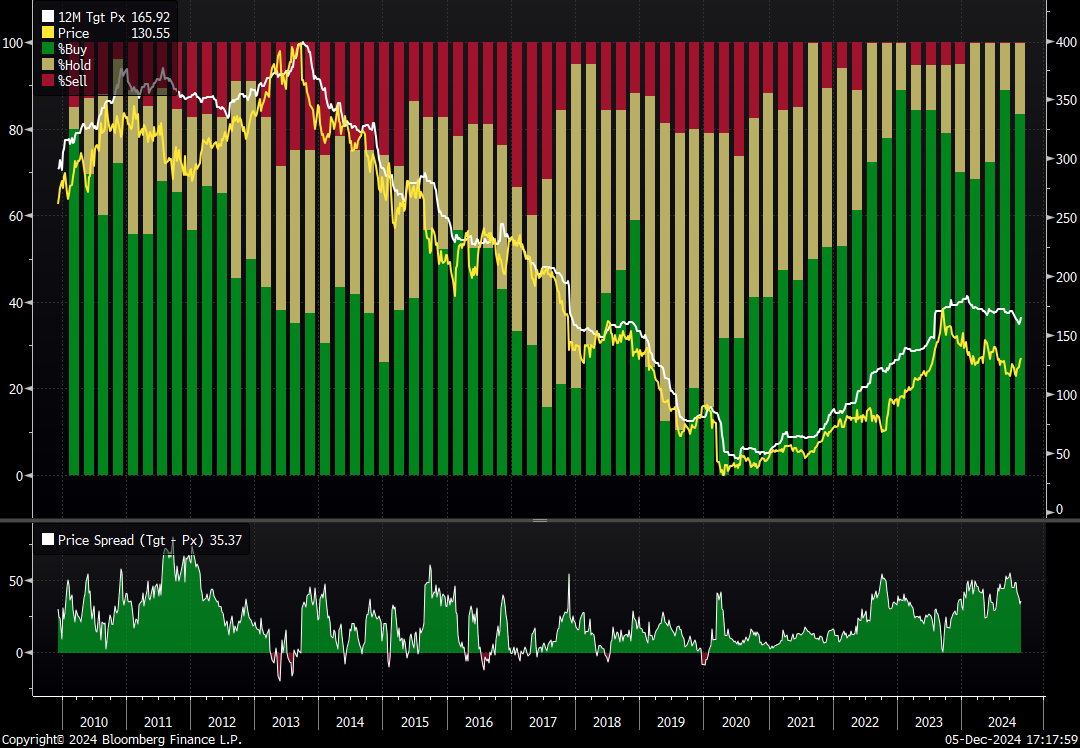
Further evidence came from the analysts covering WBA. As a group, the analysts are rarely ahead of the curve (the good ones are), but certainly latch onto the trend. The price (yellow) peaked in 2015, and they have downgraded the company’s value ever since. There have been fewer buyers (green) and more sellers (red), with many analysts sitting on the fence (neutral or hold means sell in analysts’ parlance).
Walgreens Boots Alliance Analysts’ Consensus Target Price
Contrast that with CNA. The analysts had been bearish but turned in late 2020 and have been supportive ever since. Recently, there have been more buyers and no sellers, which implies the company has returned to good health.
Centrica Analysts’ Consensus Target Price
The EVS is an enhancement to the PSR. Both are useful ratios and if the balance sheet is stable, they tell you the same thing. It is not the absolute level of EVS that I focus on, but where it is today compared to its history. More on that in future issues of My Journey in Finance.
Perhaps I should revisit CNA. It seems to offer good value.
A Week at ByteTree
In The Multi-Asset Investor, “Lower Rates Lead to Real Estate”, I continued from the previous week’s addition of long gilts and looked at commercial property. The price is right, and the worst is behind it, especially if the sector faces lower rates next year.
In Venture, I looked at a European software company, which, funnily enough, scored well on an EVS. The valuation is cheap, it’s growing, and the analysts are behind it. What’s not to like? We also took profits for Keller Group Plc (KLR). KLR was recommended on 28 November 2023 at 809p. A year has passed, and with the price at 1542p, having collected 47.9p in dividends, the stock has returned 97% with an IRR of 93%. It was a fabulous opportunity.
In The BOLD Rebalancing Report, “Opposites Attract”, the BOLD Index saw one of the largest rebalancing transactions in recent history as November saw Bitcoin surge 38.5% while gold fell by 3.7%. BOLD’s job is to get that back into line each month, to keep the risk steady.

Finally, in ByteFolio, “Trump in, Gensler Out, Altcoins Up”, the team looked at the rally in altcoins, which is starting to go nuts. I think we have seen this movie before. As I keep on saying, crypto is the only asset class with a sense of humour.
Have a great weekend,
Charlie Morris
Founder, ByteTree.com
We would love to hear your feedback, so please share your thoughts in the comments. It would really help us if you could like, restack/share this update and subscribe to our Substack. Thank you so much for your support!


