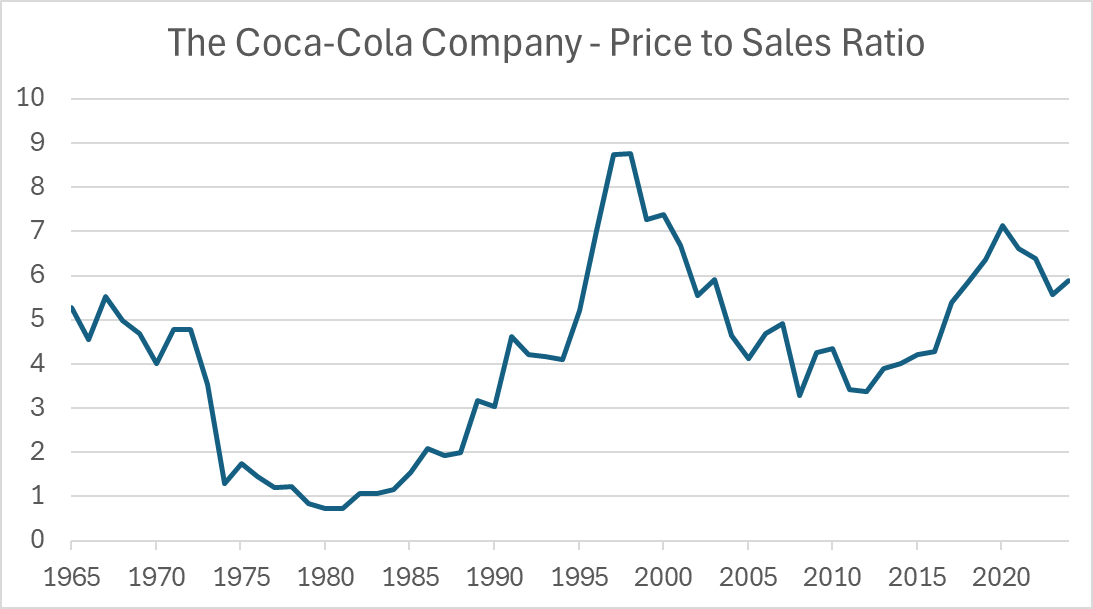
The price to sales ratio (PSR) for Coca Cola (KO) demonstrates how a stable company with similar products over the years has seen the valuation range between 0.7x sales (cheap) in 1980 and 11x sales (rich) in 1998 (note the intra-year 11x peak is not shown on the annual chart). This valuation range is wide with completely different investor perceptions of the company held at different times.
Investors had different outcomes depending on when they bought KO, not so much due to time, but price. The best time was when it was dirt cheap, which was when the PSR was below ~1.5x between 1980 and 1990. If they did that, annualised returns would have been over 20%. If on the other hand KO was purchased when it was expensive, 1995 to 2000, returns were much lower.
Coca Cola Returns (capital only)
Warren Buffett and the late Charlie Munger bought KO in 1988 after the 1987 stock market crash. It went on to do very well and Berkshire Hathaway still owns 9.3% of the company to this day. The price you pay will heavily influence future returns, and this is an important investment principle. If you get a good price like Berkshire did, returns are likely to be high, but pay too much for a great company, and the chances of being disappointed remain high.
Looking beyond PSR, which is a simple and timeless measure of value, it is important to recognise that the specific level of the PSR is not particularly relevant. Highly profitable companies, such as software, will naturally have high PSRs and deservedly so, in contrast to lower margin business, such as supermarkets, which will have lower PSRs. That’s because higher margins mean higher profits, and the stockmarket loves profits above all else.
I like the PSR because sales are much more stable than profits, and so it works as a valuation constant. But I do not target companies at specific levels or anything like that. The PSR shows how much the market is willing to value the company’s sales over the years, and that fluctuates. One piece of useful information is the long-term average which for KO is 4.2x, which can be compared with the level today, 6x. For long-term investors, KO is more likely to be a good investment if acquired below its long-term average than above.
If you bought a stock at a particular level of PSR, and held it for ten years, the bulk of your capital return would be the company’s growth plus or minus the changes in the PSR. In other words, if you sold it for the same PSR as you bought it, your return would equal the company’s sales growth. If the PSR doubled, your return would double - and halve if it halved. There are also dividends, which are added to the capital return to make up the total return.
I believe this is a very simple way to think about equity returns, and because the future sales are unknown, as is the future valuation, the price you pay is the only thing an investor controls.
The Pepsi Challenge
Coca Cola and Pepsi (PEP) are well known competitors, and in most peoples’ eyes, very similar companies. Yet financially they are poles apart. KO has traded at an average PSR of 5.3x since 1991, which is more than twice PEP’s level of 2.4x.
Coke vs Pepsi Price to Sales Ratio
When you dig into the details, they are very different companies. Over the years, PEP has moved into snacks such as oat bars and crisps (potato chips in American), which have lower margins than drinks. KO has had average gross margins of 63% over the past 30 years in contrast to PEP which has had 54.7%. Investors received slightly higher profits from KO, but paid less than half for PEP shares, during a period where the dividend yields were closely aligned. Looking at the share prices since 1991, PEP investors have beaten KO by nearly 2x, with 10.3% annual returns versus 8.8% p.a. for KO, after including dividends.
Coke vs Pepsi Capital returns
It turns out that both companies had similar sales growth, meaning that the single most important factor to determine returns was valuation. Being cheaper gave PEP investors a head start over KO investors.
Tesco vs Sainsbury
There are other natural competitors such as the UK supermarkets Tesco (TSCO) and Sainsbury (SBRY). The average PSR for TSCO was nearly twice that for SBRY, but this time, the market was right. TSCO has grown nearly twice as quickly, and with higher profitability, making TSCO investors three times better off than SBRY since 1997.
Tesco vs Sainsbury Price to Sales Ratio
Despite having high free cash flow, supermarkets are a low margin industry. Having a competitive advantage is crucial, and the company with the lowest cost base wins. The PSR didn’t tell us this and so further digging is always required, but the PSR chart is still revealing. It tells us that supermarkets have been steadily derated over decades, which demonstrates how competitive the industry has become. The PSR can also be used to identify tactical entry points, such as we saw in 2022, after the pandemic supermarket fanfare. The PSR was unusually low, and TSCO has nearly doubled since.
Rio Tinto
Moving on to the diversified mining giant, Rio Tinto (RIO). Pre-2008 the great trade was global growth, as the emerging markets blossomed, and natural resources were in high demand. Then after the financial crisis in 2008, growth slowed. I find it fascinating how quickly the stockmarket correctly repriced RIO from a PSR of 3.5x to 2x, after a brief period of confusion and mayhem during the crisis. It shows how closely the RIO share price follows sales, which since volumes have slowed since the heydays, are largely determined by commodity prices. RIO was a little cheap in 2015, during a commodities bust, and a little dear in 2021, during a commodities boom, but has generally been rationally priced.
Rio Tinto Price to Sales
In the case of RIO, the PSR reveals something that no other ratio would show with quite the same clarity. Earnings have been volatile while debt levels have varied. Yet the PSR for RIO is a gentle heartbeat confirming that the share price is close to where it probably ought to be.
Apple
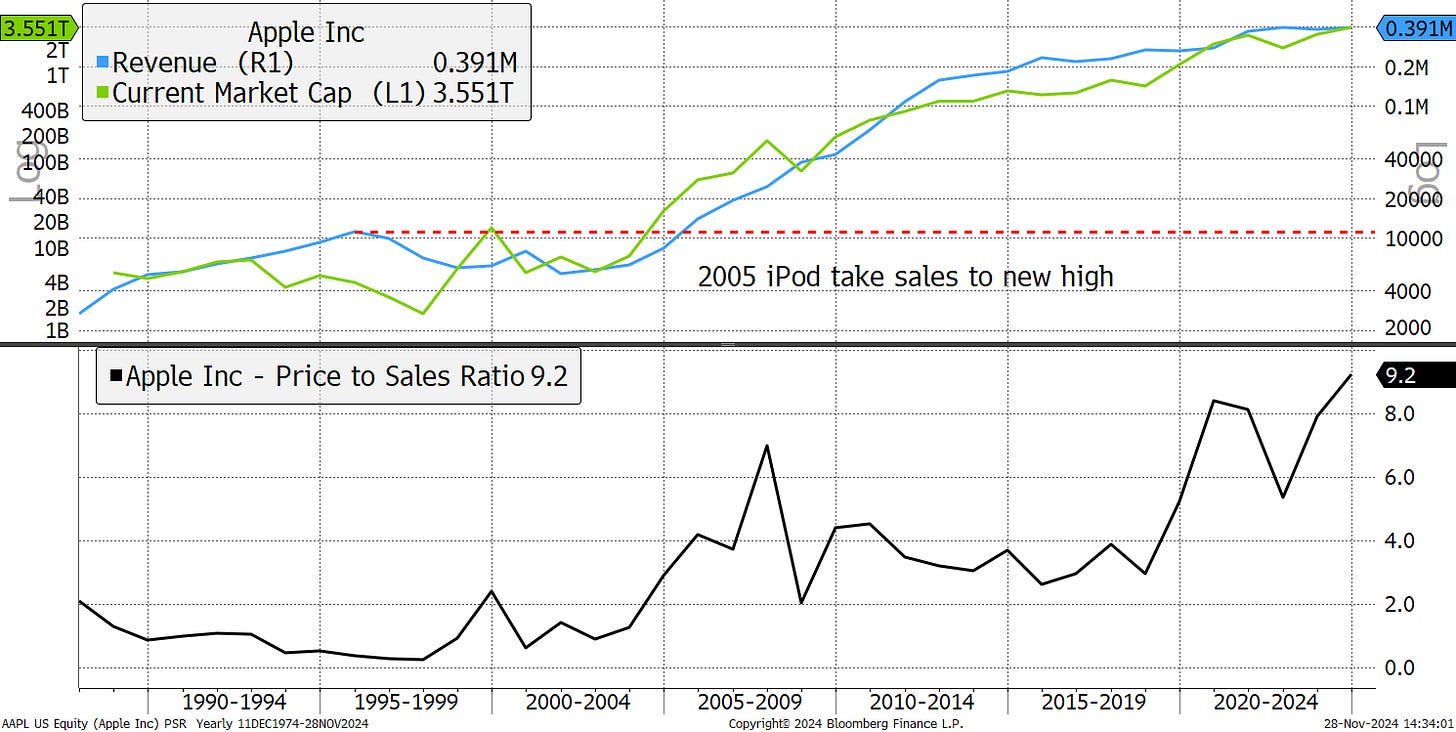
The finale is Apple (AAPL) which was a troubled company for much of its life on the stockmarket, until Steve Jobs returned and launched the iPod. Jobs founded AAPL in 1976, was fired as CEO in 1985, only to return in 1997 when AAPL bought Job’s new company, NeXT. By 2002/3, their products were back in vogue. They launched a phone in 2007, and the rest is history. Growth was so high that I had to use log scales in the chart. Yet curiously, the PSR today is higher today than it has ever been, despite sales growth falling flat since the pandemic, after a two-decade boom.
Apple Price to Sales Ratio
It is hard to understand why AAPL would have a higher PSR now that it is a mature company with pedestrian growth, than between 2005 and 2012 when sales were growing 50% year on year. The popular explanation is the growing profit margin, as the company has increased revenue from services. Sales from the apps, music, and data storage, have improved the “quality of earnings” as they are deemed to be recurring revenues. The view is that this is more valuable than sales generated from hardware. The hope is that if this continues, then all will be well. AAPL may not grow into its high valuation, but it may “margin” its way there instead.
But common sense tells you that the world’s most valuable company doesn’t deserve a higher valuation today than it had when it was booming. That is a ridiculous idea. But this is the stockmarket, and even KO traded at 11x sales in 1998 for a short while. Investors who bought at that time, had lousy returns, and I can only assume the same will hold true for future investors willing to pay over the odds.
A Week at ByteTree
In The Multi-Asset Investor, I wrote about the new Geddes Axe, led by Argentina, and now the USA where there is renewed impetus to balance government budgets. The new team in the White House includes the new Treasury Secretary, guru hedge fund manager Scott Bessent, alongside the DOGE team, Elon Muck and Vivek Ramaswamy. If they succeed, they’ll slash $2 trillion of Federal spending and maybe even save the bond market.
In The Adaptive Asset Allocation Report, Samson and Delilah, Robin and Rashpal are struggling to hold back their discomfort with the extraordinarily high weight in US equities. They looked at the Trump playbook and the Chinese Renminbi, which will be in the line of fire.
In Venture, I looked at an interesting situation in SpaceTech. Did someone say Musk is in the White House?
Finally in crypto, there was a setback as Bitcoin rejected crossing $100,000 for the first time . The space is on fire and an alt boom is on the launchpad.
Have a great weekend,
Charlie Morris
Founder, ByteTree.com
We would love to hear your feedback, so please share your thoughts in the comments. It would really help us if you could like, restack/share this update and subscribe to our Substack. Thank you so much for your support!


