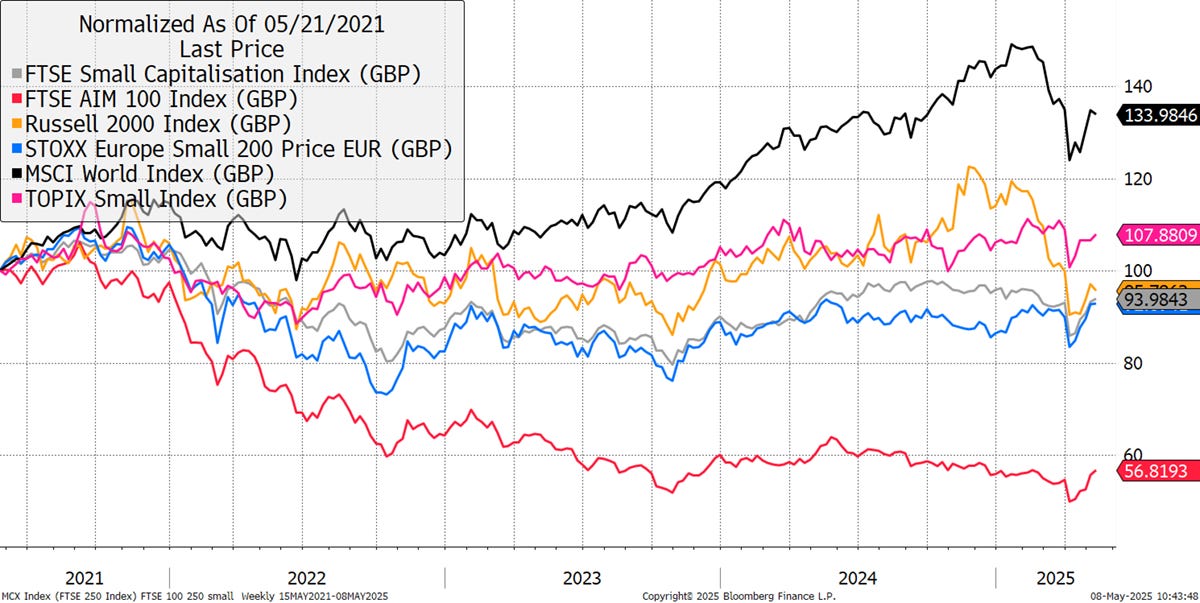
Since the 2021 tech bubble, the small-cap indices are still underwater, although only slightly. The World Index has given up some ground this year, but it has still left the small-caps behind. US small-caps, measured by the Russell 2000, have dropped from being a leader to a laggard. Japanese small-caps hold steady, with UK and European equivalents rebounding. Yet what truly stands out is the evaporation of the FTSE AIM 100 Index, which is still down 46% since 2021, and flat over the past decade.
World Large Cap and Regional Small Cap Indices – Since the 2021 Tech High
AIM is a more lightly regulated UK exchange, dominated by small-caps, but is also the home to Burford Capital, JET2, Yellowcake, and Fever-Tree. Resetting the chart to 7 April, the low following Liberation Day, and AIM is first out of the box, closely followed by UK, European and Japanese small-caps. Large-caps and US small-caps lag behind.
World Large Cap and Regional Small Cap Indices – Since the Liberation Low
This is a welcome change from last year, which became draining. There’s nothing like a tailwind when it comes to making money.
Action
Sell Smiths News (SNWS)
Keep reading with a 7-day free trial
Subscribe to ByteTree Research to keep reading this post and get 7 days of free access to the full post archives.


