Following on from book value, I move on to cash flow (CF), free cash flow (FCF), and free cash flow yield (FCF yield).
According to the accounting software company Xero,
“Cash flow refers to the money that flows in and out of your business within a specific time frame, whereas profit is what is left from your revenue once you’ve deducted your varying levels of costs (operational, taxes etc).”
In simple terms, CF looks at the bank account, whereas profit looks at the company’s books. A company might have sold goods and services that have been invoiced and delivered but yet to be paid for. It might also book profits on the revaluation of an asset, depending on US vs UK accounting standards, which is yet to be turned into cash. CF is the cash, whereas free cash flow (FCF) is the cash after the deduction of capital expenditure.
Net income (accounting profits) is the number one profit metric studied by investors. Because of how clever accountants are, this is more easily distorted and manipulated to look better than it is. Many companies have excellent profits but haven’t actually grown cash generation per share, which is the growth in money that is actually available to shareholders.
Therefore, studying the cash flows is crucial to make sure that a company is creating value and not just growing for the sake of it. It has also been shown that the lower a company’s conversion of net income to cash flow, the lower its share price returns.
Property companies generally have poor cash flow because they carry interest-bearing debt and invest in costly development, which often exceeds the rents received. By contrast, their profits can be high as they grow their asset base.
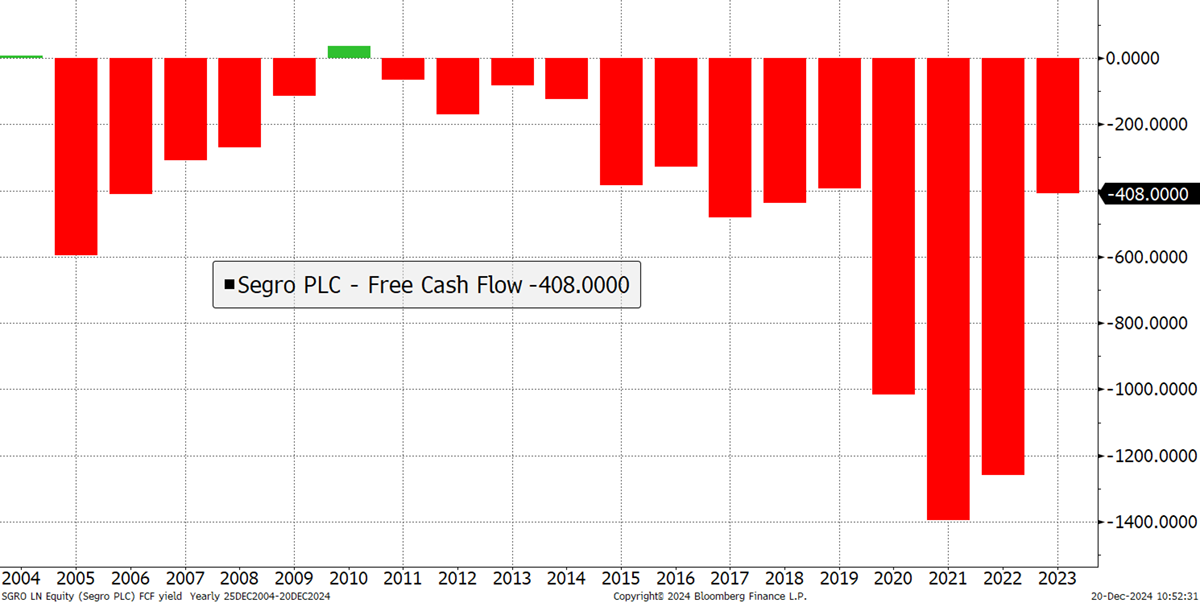
The UK’s most valuable commercial property REIT, Segro (SGRO), has rarely generated FCF.
Segro Free Cash Flow
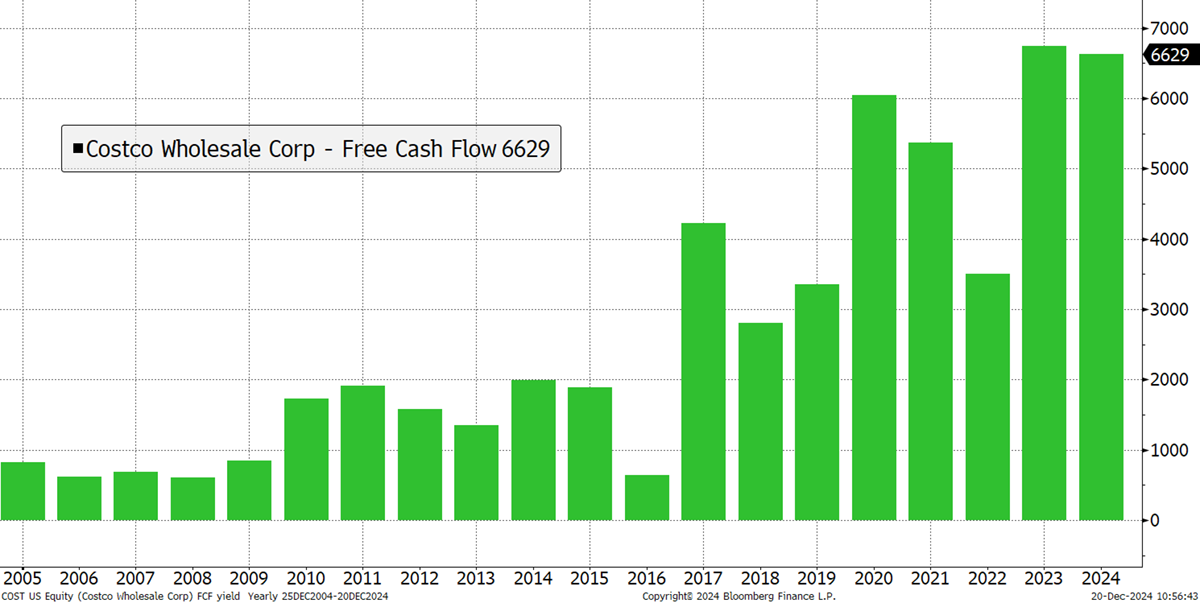
In contrast, Costco (COST), the US high-volume supermarket wholesaler for customers who like to buy in bulk, has a strong FCF. The goods for sale are delivered and sold before the invoice has been paid.
Costco was one of Charlie Munger’s favourite companies because its membership fees create high and recurring free cash flow. Warren Buffet said, “If you attempt to assess intrinsic value, it all relates to cash flows”.
Costco Wholesale Corp Free Cash Flow
The FCF yield looks at the FCF divided by the market cap. COST has a FCF yield (red) of 1.2%, yet in 2010, that was 7%. Since 2010, FCF roughly trebled, while the shares have risen 15x. Investors are willing to pay a much higher valuation for COST today than they were in 2010.
Costco Wholesale Corp Free Cash Flow Yield
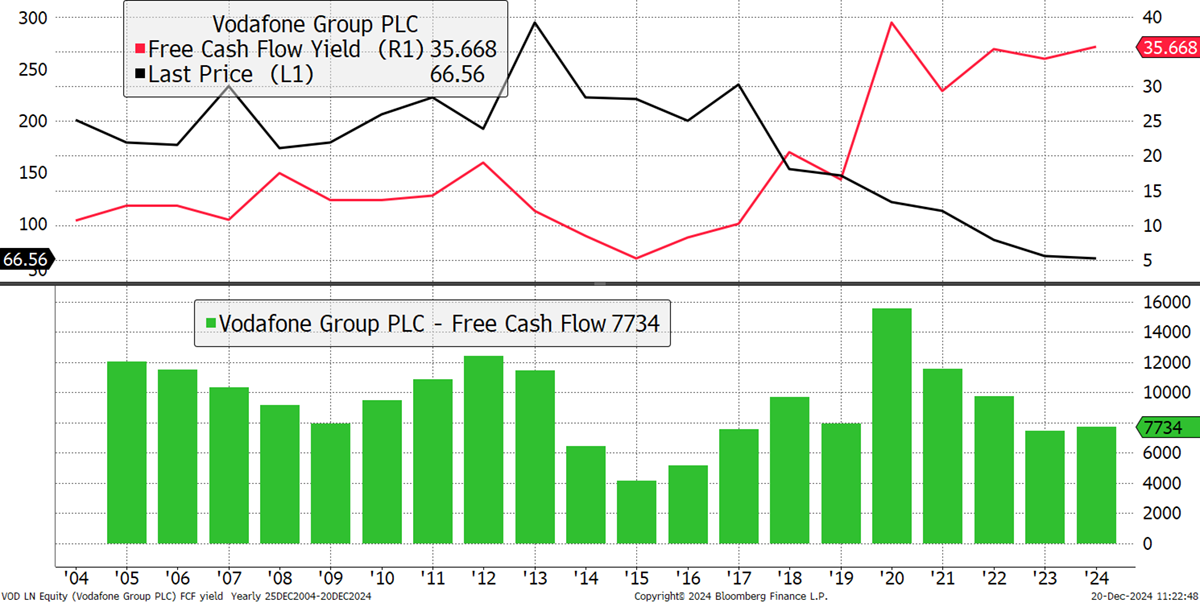
Contrast that with Vodafone (VOD), which generates healthy FCF (green). The FCF yield is a whopping 35% because the share price has fallen. The market cap was once £217 bn in 2000, and today, it is down to £17 bn. The cash flow has been reasonably stable, and the FCF yield has grown as a result.
Vodafone Free Cash Flow Yield
In the last piece, when we looked at Enterprise Value, it should be noted that VOD has £55bn in debt, making the EV £65bn. Therefore, the FCF/EV yield is 13%. That is the amount of FCF an investor who bought the whole company would receive.
British American Tobacco (BATS) wasn’t always a controversial company, as once upon a time, people smoked on planes. Tobacco is a high-margin, high-FCF industry, as can be seen by the growth of the BATS CF over the years. Interestingly, with smoking collapsing in the West, it hasn’t been about sales growth but expanding profit margins as tobacco companies invest less in things like advertising and run their business for cash. The FCF yield was high in 1999, as the share price collapsed during an era of anti-tobacco litigation. The FCF yield is high again today because many investors shun tobacco stocks for ethical reasons.
British American Tobacco
Netflix (NFLX) is a good example of a fast-growing company that tolerated negative CF to attract new customers. Interestingly, NFLX had positive CF in its early days, but when growth slowed in 2012, the company doubled down and started to acquire new customers at a loss by underpricing its service. That led to higher growth until it started to slow in 2020. Thereafter, they raised prices and reduced password leakage, and the FCF ballooned.
Netflix Revenue Growth and Free Cash Flow
Looking at the share price, rebased to 100 and on a log scale, $100 invested became worth $83,799. It has been a remarkable success story that may have slumped if they hadn’t reached the benefits of scale from having a vast customer base. Most of the share price gain came between 2012 and 2021, precisely the time when FCF was generally patchy. This demonstrates that the stockmarket will reward a high-growth stock, which generates profits but loses cash, provided they have faith in the end game.
Netflix Share Price
Summary
Free cash flow is, first and foremost, a measure of a company’s health, as a company that isn’t generating cash is more at risk than one that is. Furthermore, that cash can be reinvested in expansion, paid out in dividends, or used to buy back shares, all of which benefit shareholders.
In fundamental analysis, cash is king.
In the My Journey in Finance series, ByteTree Founder Charlie Morris shares some of the lessons learned during his three-decade-long professional career in finance and investing.
We would love to hear your feedback, so please share your thoughts in the comments. It would really help us if you could like, restack/share this update and subscribe to our Substack. Thank you so much for your support!


