

Hardware or Nowhere
Issue 66
Tech hardware widens its lead.
Asia is weak when you strip out tech hardware.
Toyota shows how tariffs are starting to bite.
“Global Trends tracks where global momentum is flowing — across countries, sectors, and stocks — giving investors the opportunity to act before the crowd.”
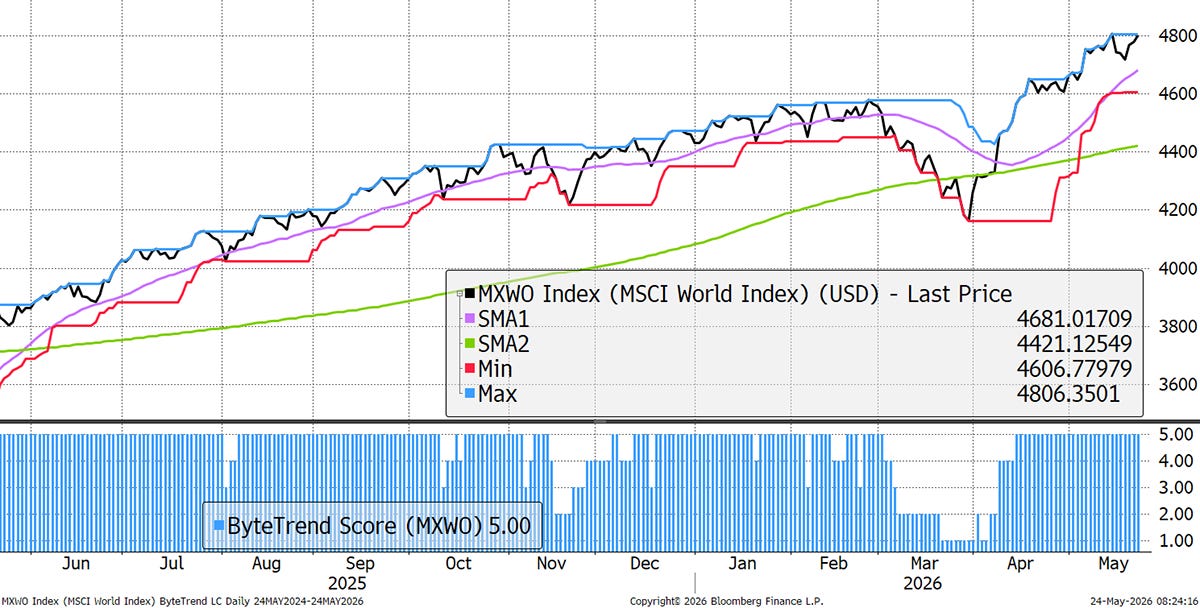
The World Index maintains a bullish ByteTrend Score of 5 in USD. It retested the all-time high despite bearish signals last week.
World Index – Developed Markets – Daily
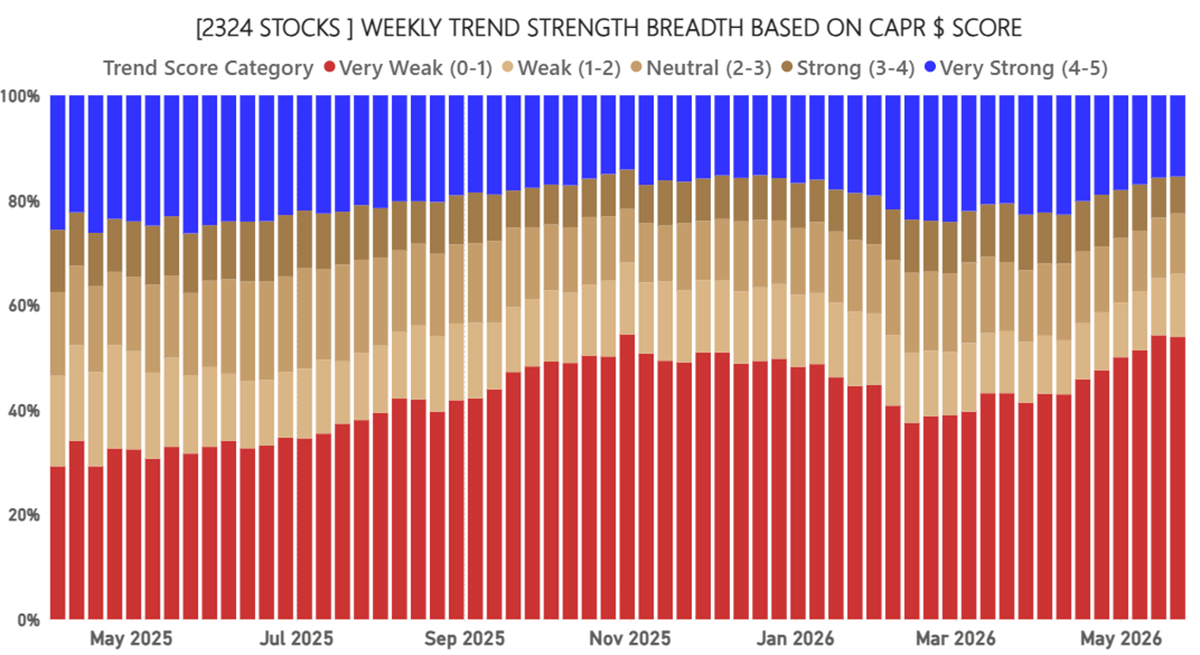
Global Equity Breadth – CAPR
The number of stocks beating this market continues to decline. Outside of Technology Hardware, little is happening.
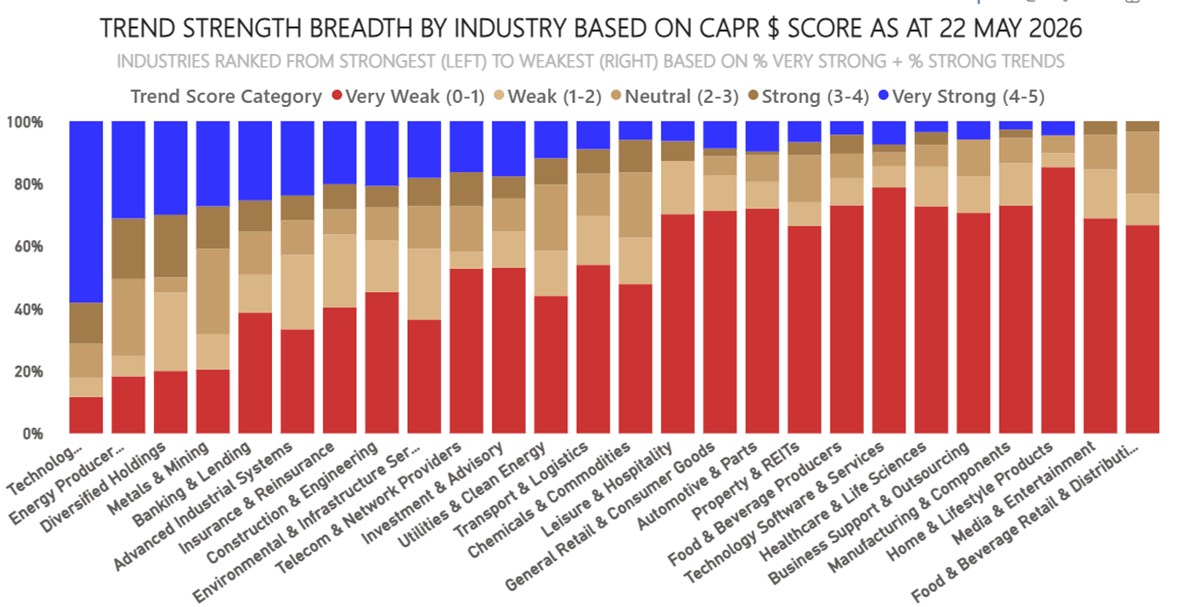
Industry Trend Score Categories in CAPR
Tech hardware dominates, with over 50% of stocks beating the market. Energy comes second, alongside other commodity themes. The consumer-facing sectors remain weak.
Net Winners - Stay Long Energy, Materials, Financials
The winners-less-losers metric guides asset allocators. Technology is mixed here because at the sector level, rather than the tech hardware industry level, software drags it down. Energy, Financials and Utilities remain strong.
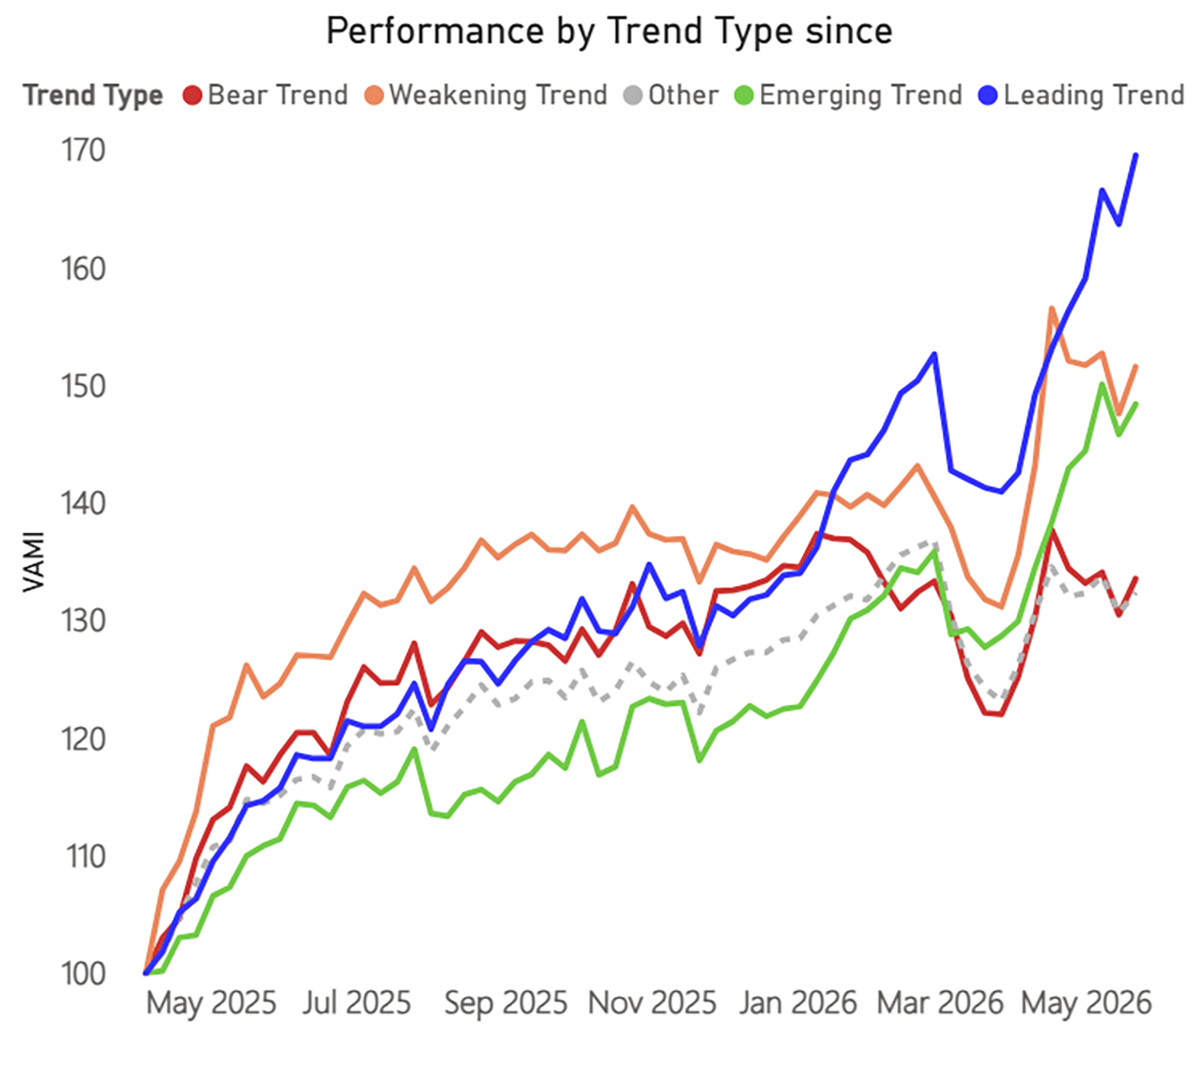
Trend Type Performance
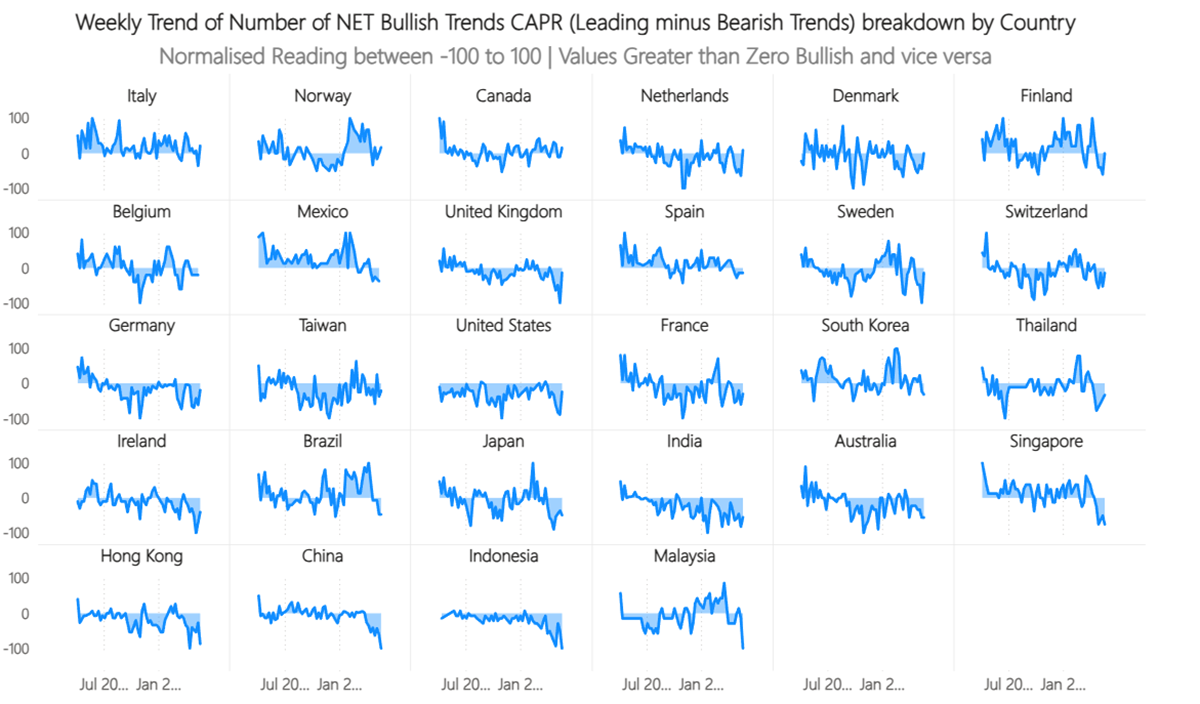
At the regional level, Europe is coming out quite well, in contrast to Asia, which is seeing weakness. Something is wrong in the East.
Trend Type Performance
The leading trends are firmly ahead. Emerging trends are also strong but lack breadth, as they have become a small group. Weakening trends can do well too, as they are oversold stocks. The bears are now being left behind, but crucially, they are not falling. When they do, that will signal an increased risk of a bear market.
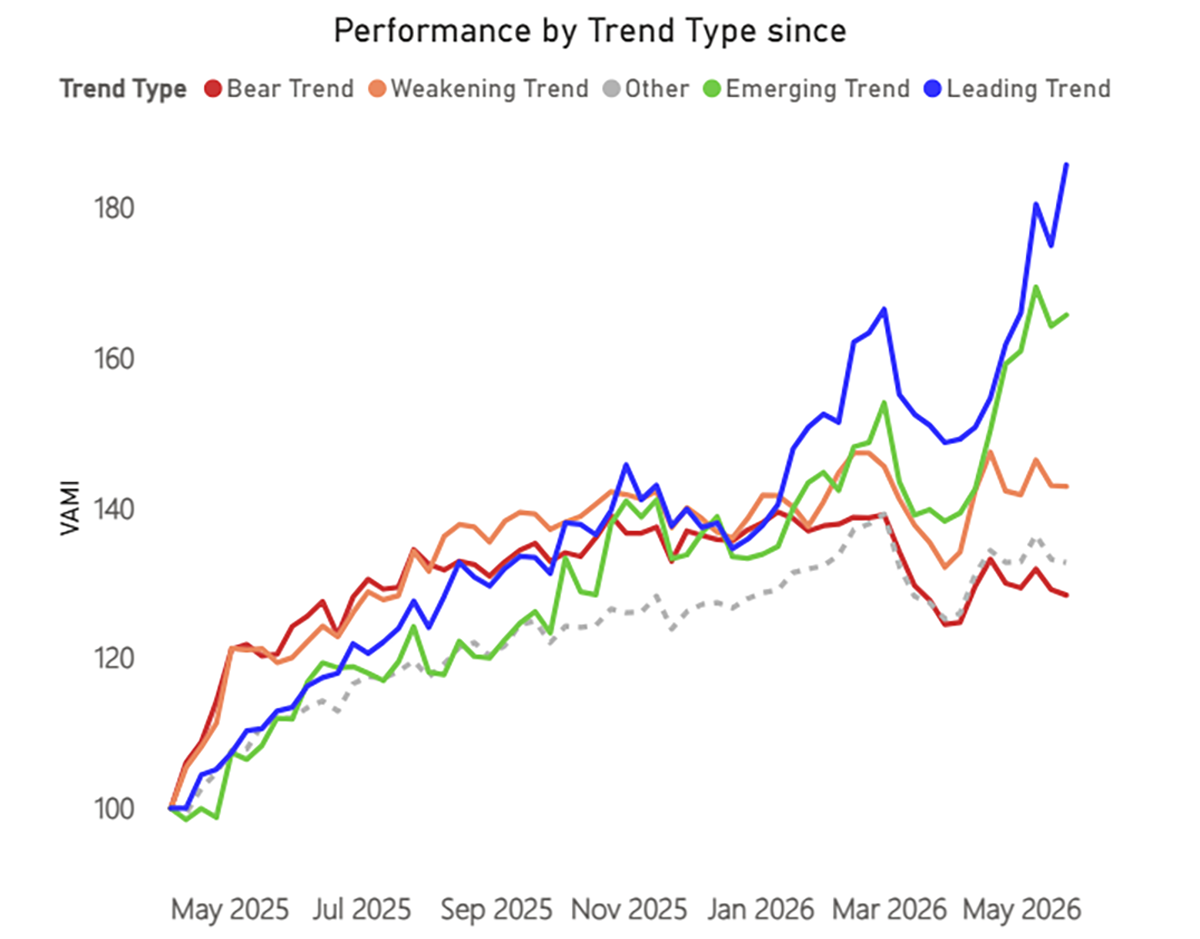
Trend Type Performance - Asia
In Asia, the leading trends are flying, while the bear stocks are looking uncomfortable. This level of divergence is extreme.
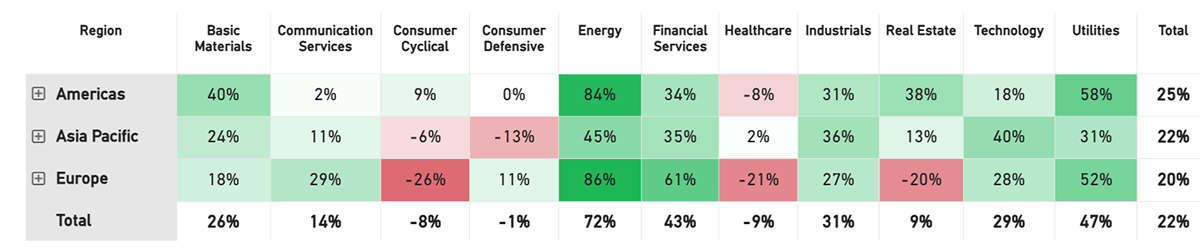
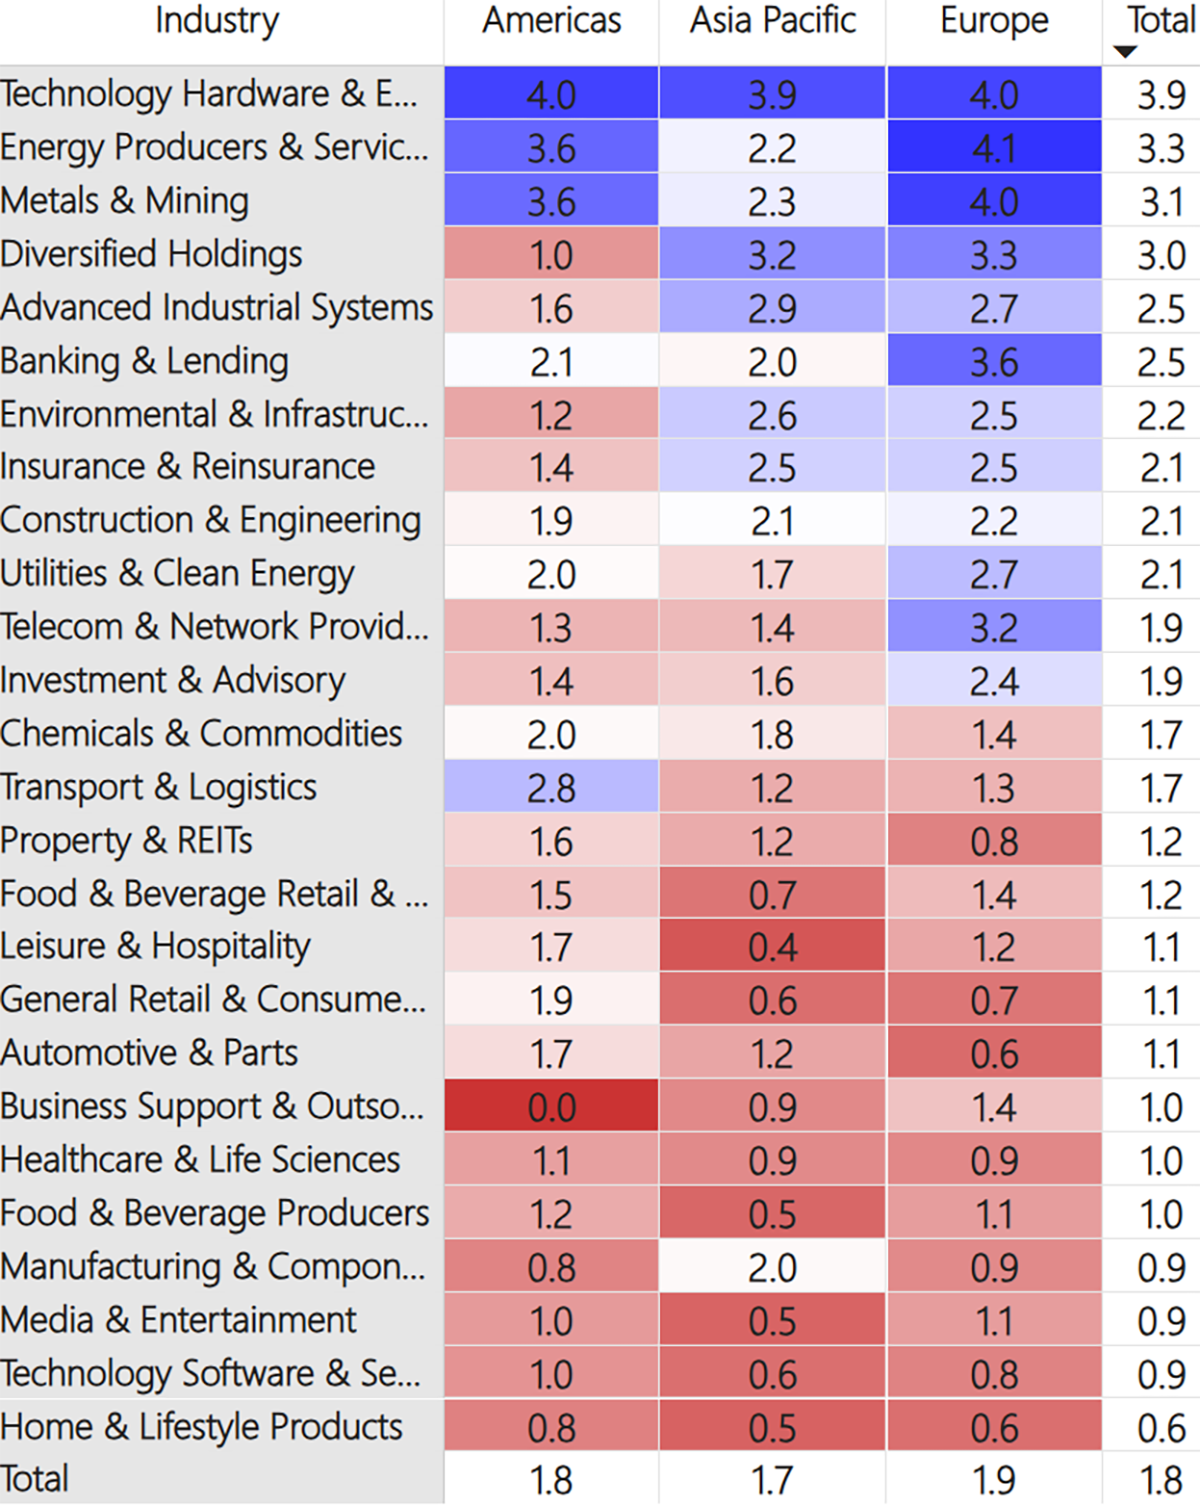
Regions and Industries Average Relative Score
This table (below) shows the average CAPR score for each global industry, by region and in total.
At the top of the table, Tech Hardware rose again, and it is now the strongest sector by a wide margin. Energy producers fell again and haven’t risen in relative terms since the end of March. Metals & Mining stocks began their relative decline in late February, and their fall has accelerated further, going from a 3.4 to a 3.1 in just the last week. Diversified Holdings and Banking stocks also weakened slightly against the index last week.
In the middle of the table, Environmental and Infrastructure stocks fell sharply, from 2.5 to 2.2. However, most other sectors remained stable, including Insurance, Investment, Transport, Property, Leisure, and Food & Beverage. Utilities rebounded slightly after a tough month.
At the bottom of the table, Auto stocks weakened further. They started the year with a score of 2.5 but now register only 1.1, making them the 8th-weakest industry. Business Support and Outsourcing stocks fell too, as did Media. Home and Lifestyle (Luxury) stocks are now firmly the weakest, scoring only 0.6, while Software stocks’ comeback continues. Since the panic in February, they have risen in relative terms for three months straight.
Read the full update for free on our website: