


Gold Is Hot, but It’s Not Red Hot
Atlas Pulse Gold Report Issue 104

The notion that gold is a crowded trade is greatly exaggerated. After this enormous rally, it should come as no surprise that gold gives a little back. This will be over when gold is widely owned by investors, budgets are balanced, and there is an outbreak of geopolitical stability. We are a long way off from that. Gold is hot, but it’s not red hot, and I will look at some charts to illustrate that.

Until 2022, the gold price was all about US real interest rates, which is the US treasury yield less the expected rate of inflation. When real rates were falling (blue shaded), gold rallied. Recently, we have seen real rates rise alongside a strong gold price, and perhaps this is too much to handle. In the chart, I show the real gold price (gold after inflation).
Gold and US Real Interest Rates – Since 2004
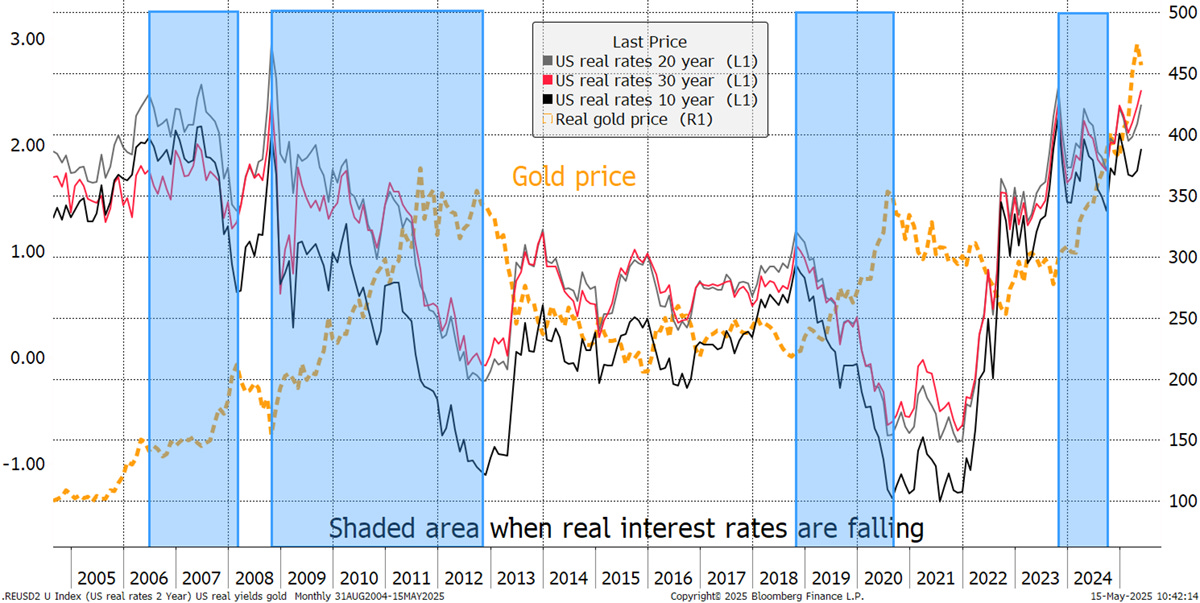
Looking at the gold price and 30-year real yield reveals how they have recently become correlated, which is bizarre. Normally, when things like this happen, we should look to other factors to explain events. In 2025, we had Liberation Day, the dollar slump, trade wars, and hot wars. Deficits haven’t gone away, and China has joined the gold rush. Let’s also not forget the increase in investment demand and steady buying from non-OECD central banks. These reasons are more than enough to understand why gold rose in the face of higher US real long-term interest rates.
Gold and US Real Interest Rates – Past Year

More recently, the dollar has bounced after a slump, and there seems to be a surge in trade deals, along with hints of peace. While these are good for mankind, they aren’t so welcome for the gold price. Yet, on a big-picture basis, the real price (adjusted for inflation) of gold is 25% higher than it was in 1980.
Real Gold Price – Since 1948

1980 was indeed a bubble, but real terms don’t catch all. It is a good gauge of the cost of living, but gold is not a consumable object. It is a monetary asset, and when compared to the money supply (M2) or, indeed, nominal GDP, the gold price is still 60% behind 1980 levels. The post-1985 average has been 28 (lower chart), so gold is ahead of that. But recall the 1985 to 2000 period was the era of the Golden Doldrums. It is only after 2008 that you can say gold has become formally relevant again, just as it was for thousands of years pre-1971, when gold came off the standard.
Gold Price and the US Money Supply and Nominal GDP

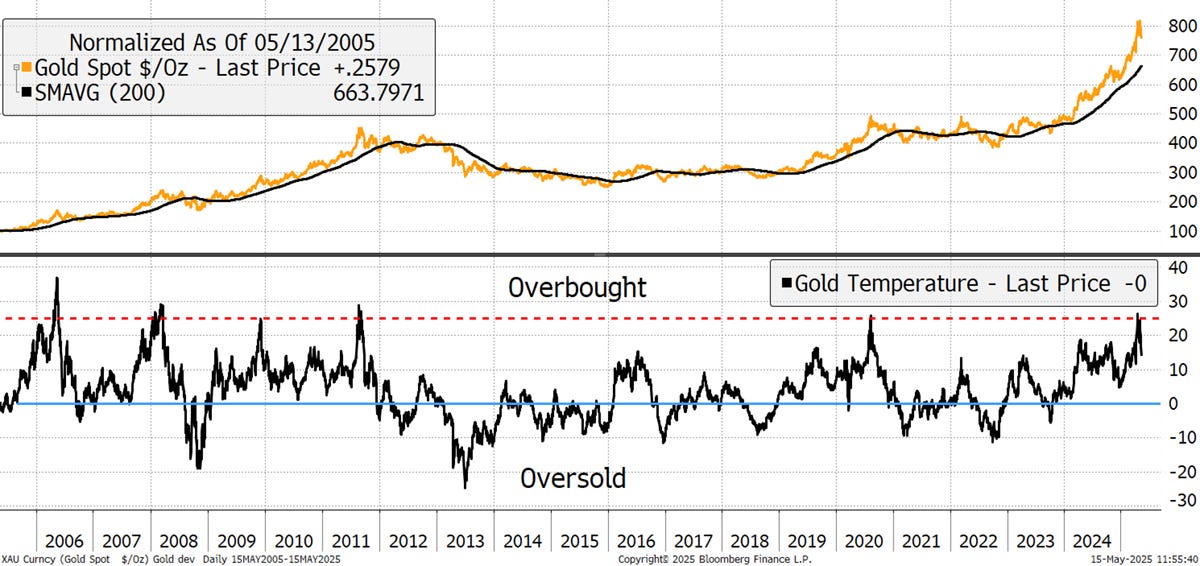
Gold is hot, but it’s not red hot, and I will look at some charts to illustrate that. I have recently been focusing on this chart, which shows the gold price and its deviation from its 200-day moving average. Recall, this chart is the gold price in US dollars, which flatters things due to its recent fall. In any event, a 25% reading above the 200-day moving average is certainly hot.
Gold Price in US Dollars – Deviation from Trend
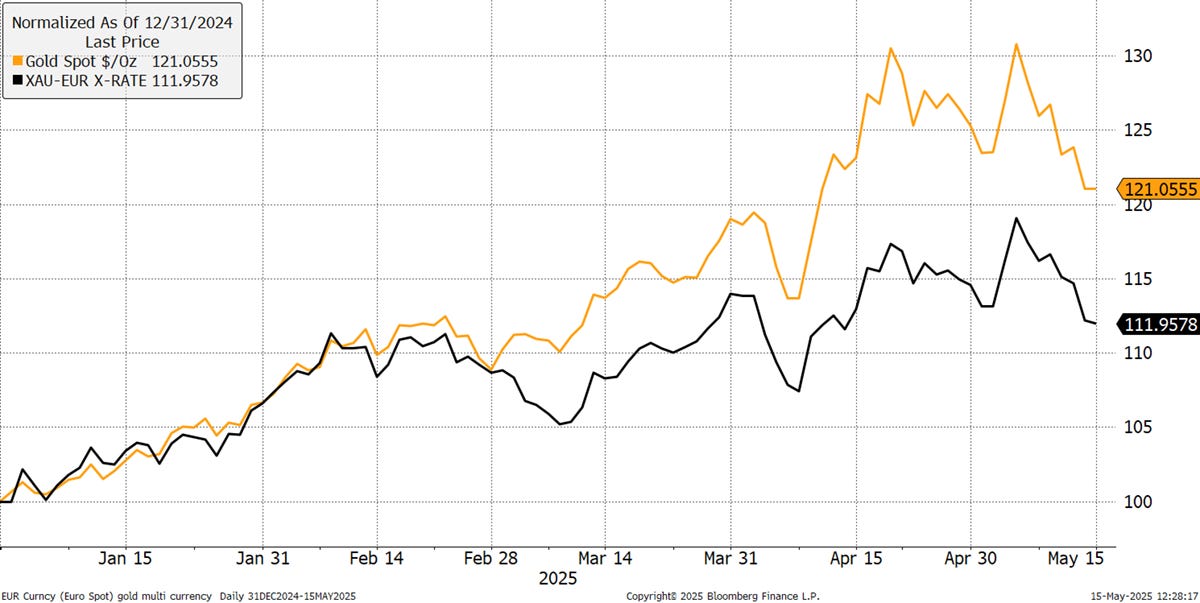
Yet, the weak dollar has caused a 10% difference between the gold price in dollars and euros this year, which is a notable gap.
Gold in US Dollars and Euros
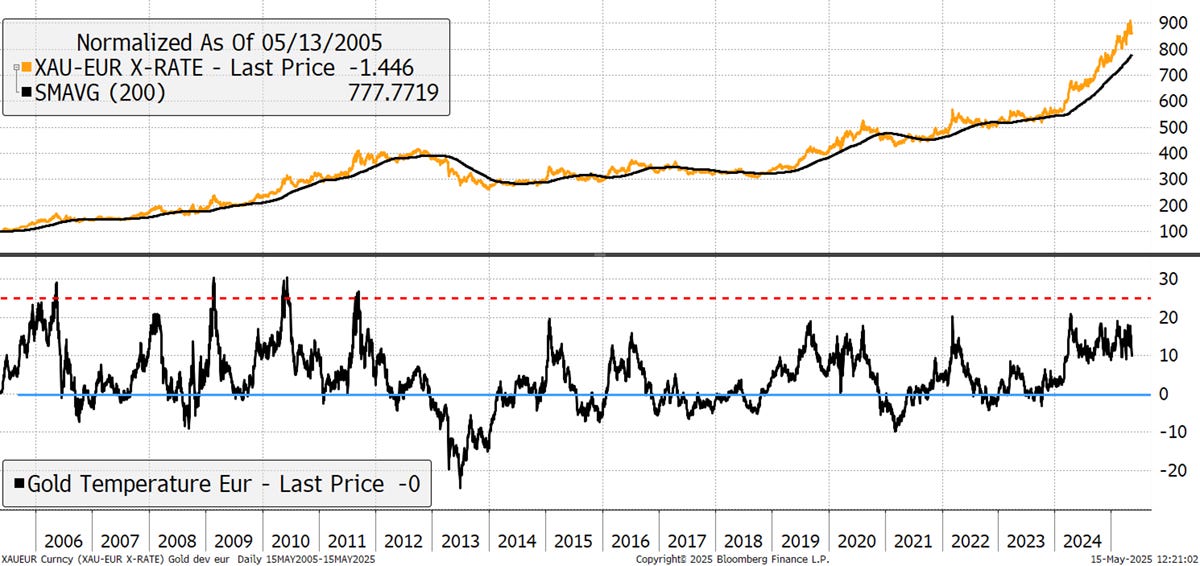
The deviation from the trend chart in euros is far less elevated than it is in dollars. Given the dollar’s renewed excitement, gold in euros paints a more stable picture, and it is not overbought at all. Indeed, being overbought doesn’t necessarily lead to a trend reversal, but rather typically a period of cooling off.
Gold Price in Euros – Deviation from Trend
Claims that gold is a crowded trade are exaggerated. The futures market doesn’t have high long positions (blue), which is a surprise given the strength of the trend. The shorts (red) are out of the picture, and the gold ETFs (green) are rising. The ETFs have been the missing link in recent years, and they represent the most speculative group of gold investors. Their interest in 2020 was elevated, leading to a material gold price correction. But this time, gold investor interest remains lacklustre, and it is a long way from being a crowded trade.
Gold Futures and ETFs

The black line above combines the longs, the shorts and the ETFs, which I would summarise as financial gold. That is the primary gold interest from Wall Street and its friends. Much has happened since 2012, and financial gold ownership of 100 million ounces remains at the same level.
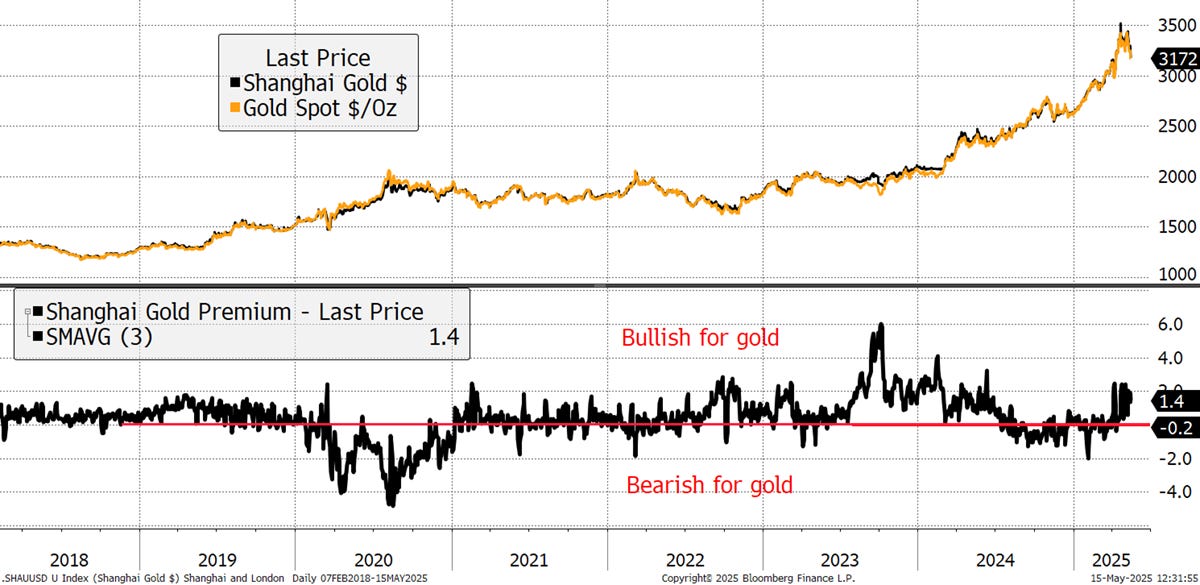
Yet there are other supportive factors, which go above and beyond the continued Central Bank buying covered in the excellent Gold Demand Trends by the World Gold Council. I would highlight the structural Chinese demand from both retail and institutions. Gold trades at a higher price in Shanghai than it does in London, and so long as that remains true, they are net buyers, which has historically been supportive for the gold price.
Chinese Demand Remains Bullish
I was asked to comment on the gold miners relative to the gold price. The miners are supposed to be geared plays, but in ten years, the miners and the gold price have delivered the same return. Naturally, the best gold stocks have done much better.
Gold and the Miners

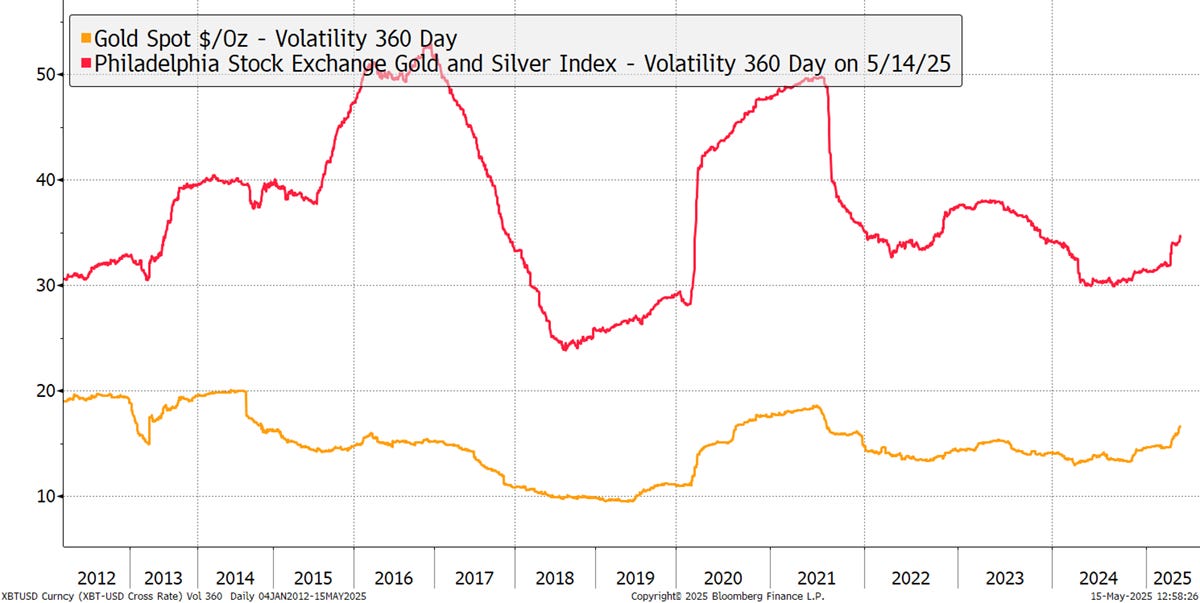
That same return between gold and the miners came with twice the volatility. Investors were not rewarded for the higher risk.
Gold and the Miners – 360-day Realised Volatility
Every gold bull knows this can’t last, and sooner or later, the gold miners will rocket. In recent issues, I have highlighted the outflows from the large gold mining funds, which investors have kept on selling. At $14 bn in assets under management, the US GDX ETF is the largest gold mining fund. Since April 2024, it has seen 28% of its shares sold. While the fund returned 38%, assets are flat because investors have kept dumping the fund. This is most odd during a bull market. The good news is that yesterday, it saw its first inflow this year.
GDX Shares Outstanding Down 28%

Celebration is premature, but nothing sends stocks higher faster than investors buying them. And they should buy the gold miners because they are cashing in on this gold bull market in a spectacular manner. Free cash flow for the gold miners (blue) is rising strongly and much faster than the gold mining sector. The gold miners offer good value.
Gold Mining Shares and Cashflow

I was also asked to comment on Basel III and its impact on gold. My colleague, Kit Winder, gave a helping hand.
What Does Basel III Mean for Gold?
Basel III is the final round of capital adequacy proposals from the Bank for International Settlements in Switzerland, which is owned by member central banks and acts as their banker. The latest rules are part of a series aimed at keeping the banking industry safer after the 2008 financial crisis, and the March 2023 regional banking crisis, which was set off by the collapse of Silicon Valley Bank and First Republic Bank. The proposed rules will require large banks, with $100 billion or more in total assets, to increase the capital that they hold in reserve by 15-20%, depending on their profile. Naturally, there is pushback.
But what does Basel III mean for gold? The Basel framework prescribes what counts as capital reserves within different tiers. A certain amount of Tier I capital must be held, which has meant cash or highly liquid government bonds, and this is what they are proposing to increase. They are also proposing to reclassify gold from a Tier III capital asset to Tier I. By elevating gold to Tier I status, Basel III would allow banks to hold more of it as part of their core capital, reducing the need for additional capital to back these holdings. This ruling has the potential to introduce a new structural source of gold demand.
It’s bullish. Just as a standard investment portfolio should probably hold 5% to 8% gold, other institutions should follow suit. Central banks are increasing their gold reserves, and private banks should do the same. Previously, the banks had been penalised for holding gold, but this ruling recognises gold for what it is: pristine capital.
21Shares ByteTree BOLD ETF (BOLD)
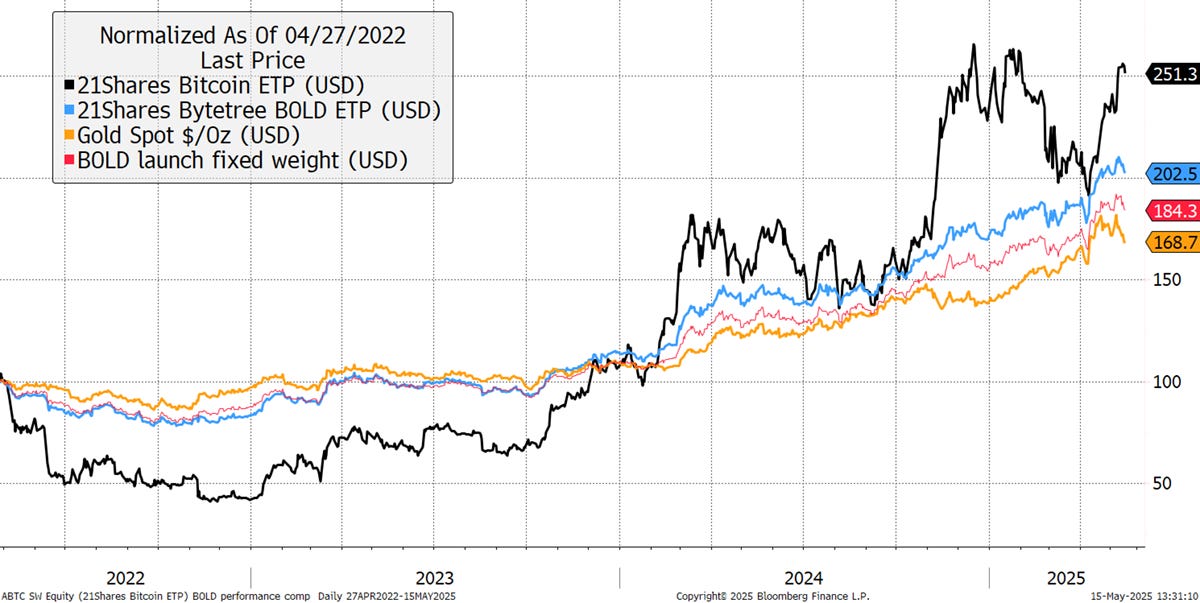
BOLD was listed in Zurich on 27th April 2022 and passed its third anniversary in April. It has beaten gold, yet lagged Bitcoin, delivering 102% for investors since inception. Not only has the concept proved to be robust by shrugging off the 2022 Bitcoin bear market, but profitable too. The red line shows the return of an investor that started with the same Bitcoin and gold weights as BOLD but didn’t rebalance. BOLD is 18% ahead, and that comes after including fees. Not only that, but Bitcoin is more volatile than the gold miners, whereas BOLD is 1% or 2% more volatile than gold. Go BOLD.
BOLD and Fixed-Weight Bitcoin and Gold - Since Inception
Learn more about BOLD and explore our data on BOLDETF.com.
Summary
The notion that gold is a crowded trade is greatly exaggerated. After this enormous rally, it should come as no surprise that gold gives a little back. This will be over when gold is widely owned by investors, budgets are balanced, and there is an outbreak of geopolitical stability. We are a long way off from that.
Charlie Morris is the Founder and Editor of the Atlas Pulse Gold Report, established in 2012. His pioneering gold valuation model, developed in 2012, was published by the London Mastels Bullion Association (LBMA) and the World Gold Council (WGC). It is widely regarded as a major contribution to understanding the behaviour of the gold price.
Thank you for reading Atlas Pulse - the Gold Dial remains on Bull Market. We would love to hear your feedback, so please share your thoughts in the comments below or contact Charlie at charlie.morris@bytetree.com. If you liked this article, please leave us a heart, restack/share this update and, if you haven’t already, subscribe to our Substack - it really helps; thank you so much for your support!