

Blockade
Issue 60

Broad rally in the run-up to peace talks, which have ended.
Oil is back above $100.
The money supply grows.
In financial markets, money behaves like water, as it will always find somewhere to go and fill the cracks. That describes relative performance - what is working and what is not. The amount of water in the system describes market performance – are stocks rising or falling?
Global Trends is a deep dive into global equities. The aim of this analysis is to better understand which countries, sectors, industries, and stocks are driving market returns. Not only does it help investors identify opportunities, but it also highlights the risks. We try to condense as much important information as possible, focusing on what really matters each week.
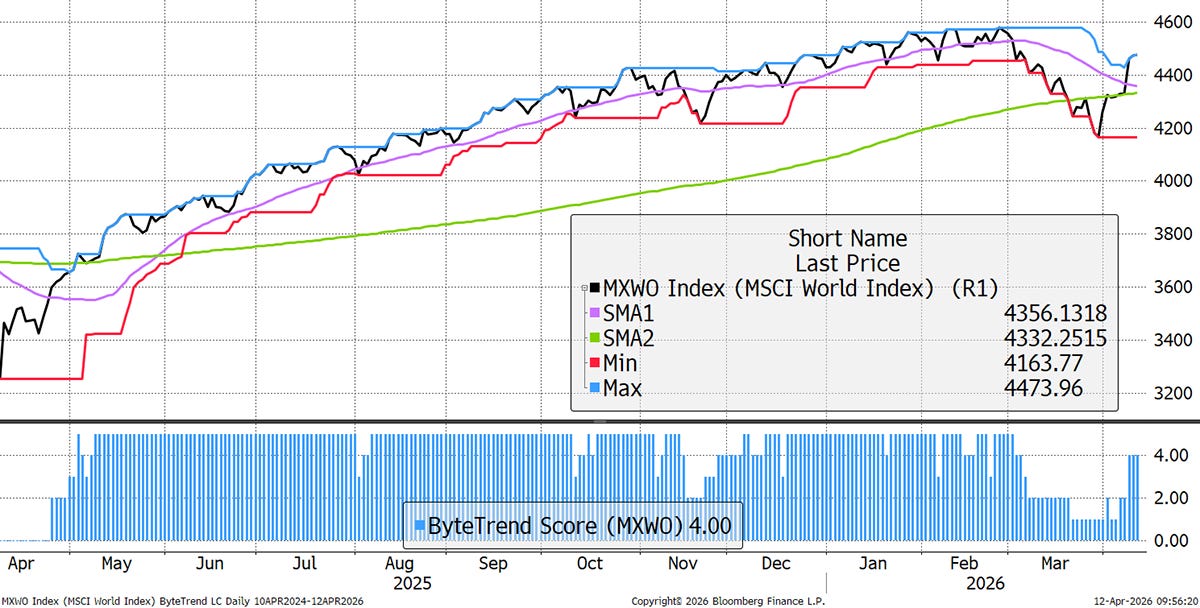
The World Index has a ByteTrend Score of 4 in USD. This is a sharp turnaround from two weeks ago, as the index trades back above its 200-day moving average. The 30-day moving average still has a negative slope.
World Index – Developed Markets – Daily
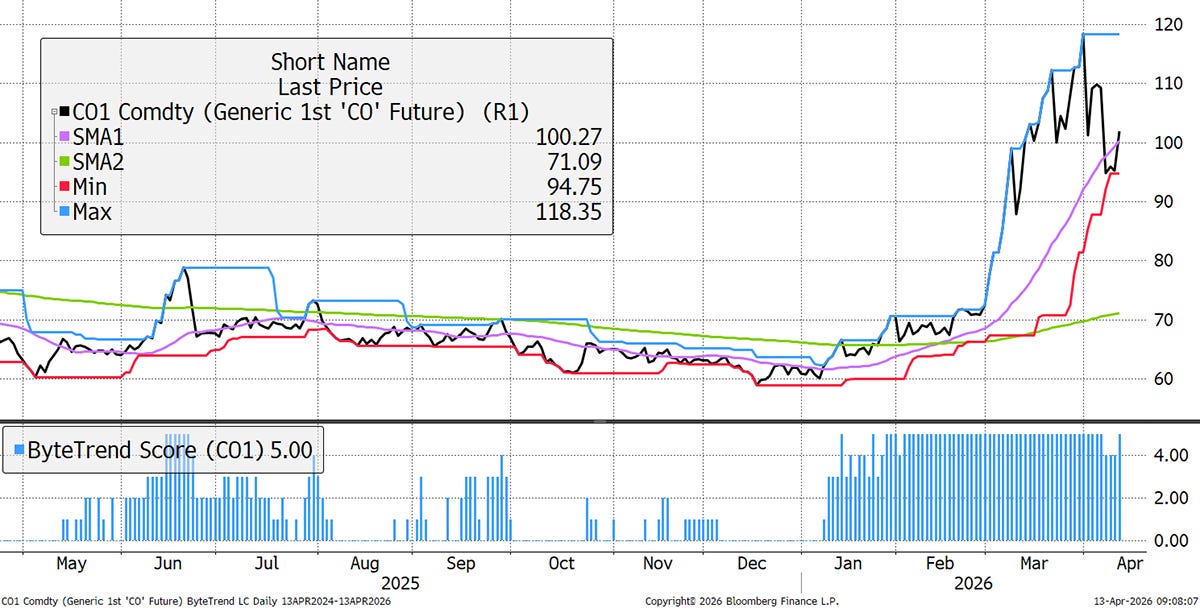
Oil Back Above $100
After a bout of optimism last week, there is now a US blockade in the Straits of Hormuz, which has sent the oil price higher. Brent Crude has a ByteTrend score of 5, having set back to 4 late last week. The risk of an oil shock remains likely.
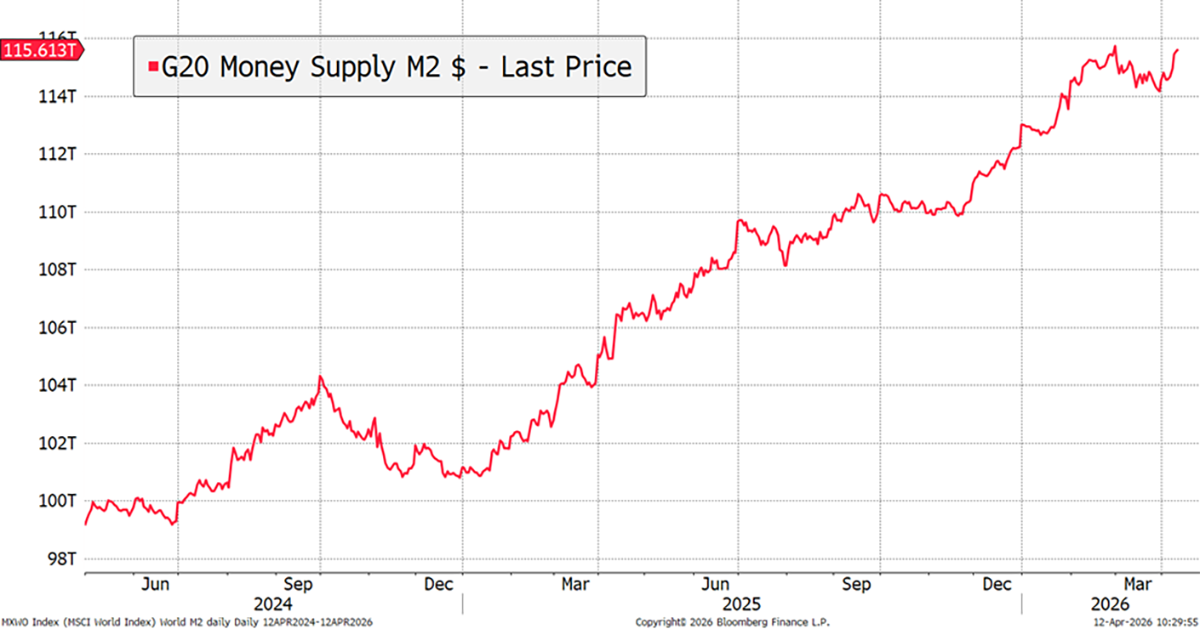
The Money Supply
After a brief setback for liquidity, the G20 money supply approaches its all-time high. There is nothing that stockmarkets like more than money itself. The money supply has also been boosted by a weaker dollar, which is down 2% in April. If the dollar stays weak, perhaps markets will remain well nourished, just as they did during the pandemic, when the economy was largely closed yet stocks rose.
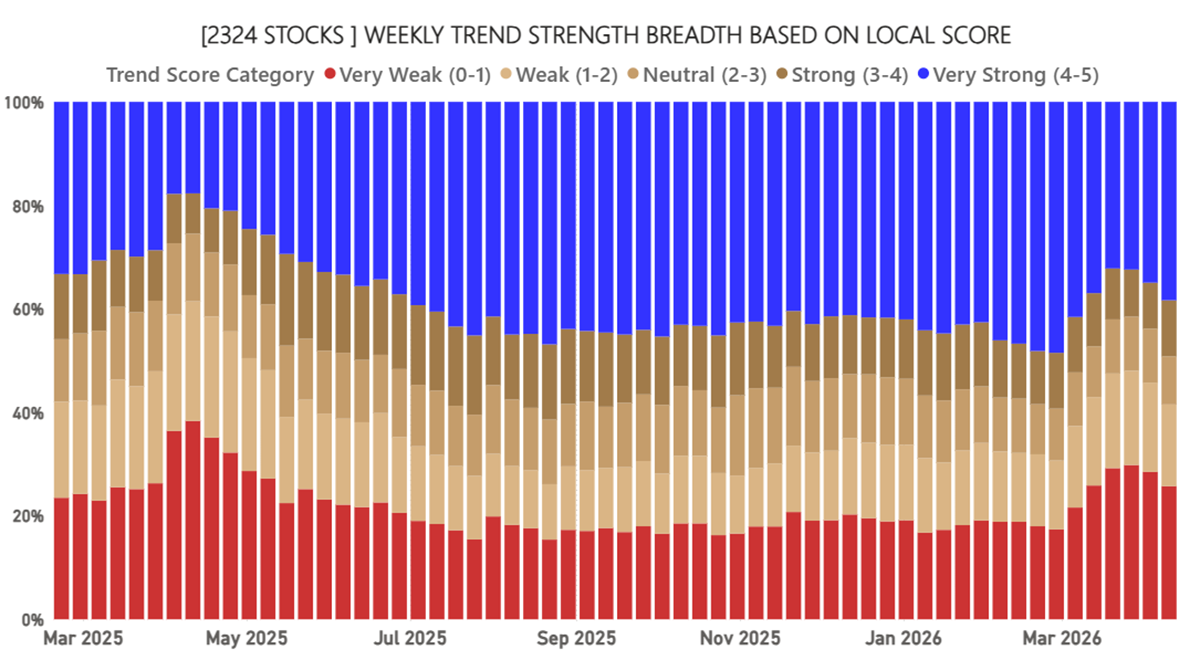
Global Equity Breadth – Local Currency
Breadth has improved for the past two weeks. This even anticipated the turn in the market on the announcement of peace talks. They have failed, but the market was likely expecting a more positive outcome.
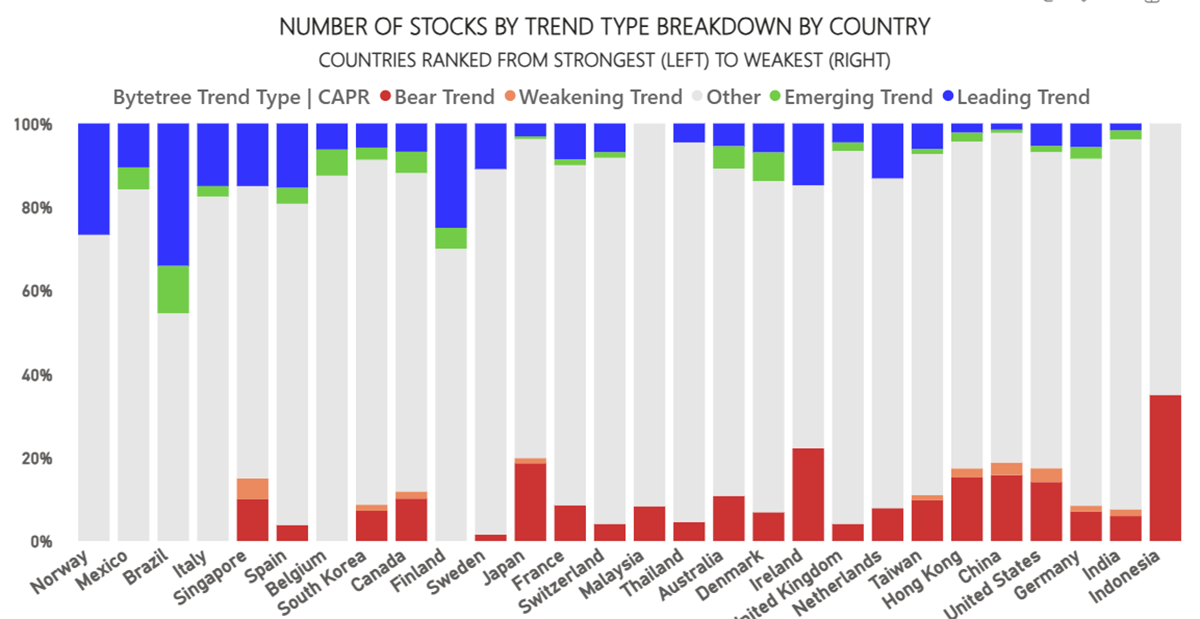
Country Breadth – CAPR
Checking in on countries, oil-producing nations are the strongest, with the surprise exception of Italy. The weakest are leading industrial nations such as India, Germany, China, and the US. Indonesia has been persistently weak for other reasons, such as the MSCI warning on EM index inclusion, as the market has poor liquidity and governance.
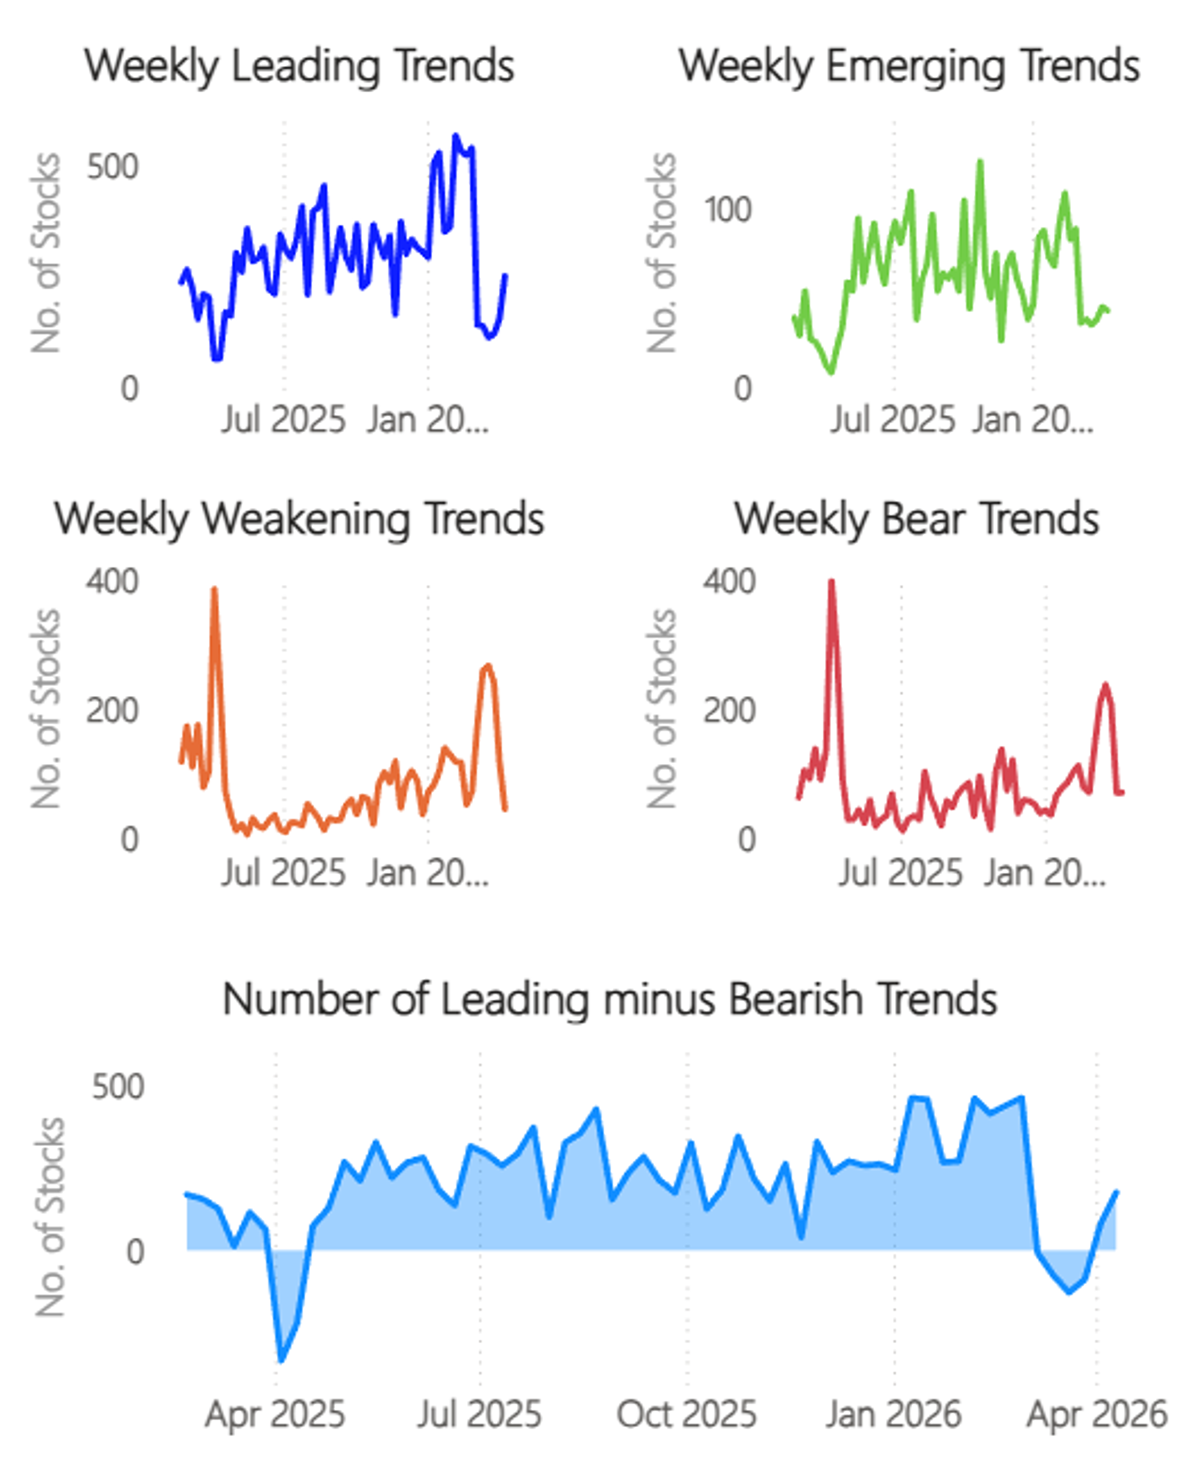
New Trends Remain Soft
The number of new price highs has improved, but not by much. More importantly, the spike in bear signals has scaled back.
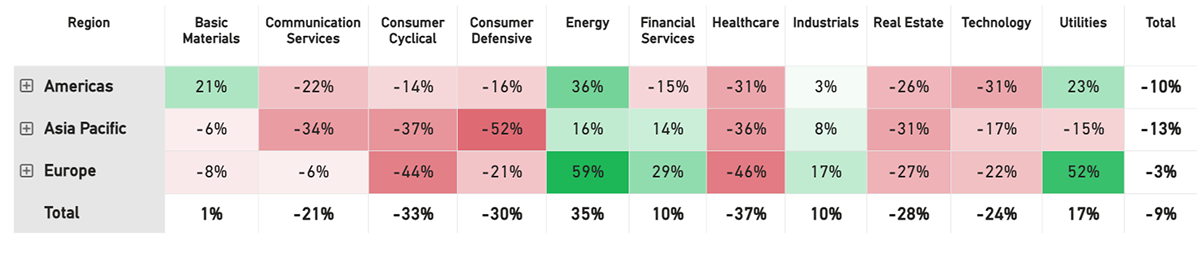
Net Winners
The winners less losers data is a powerful guide for asset allocators, which reflects what a momentum long/short strategy should look like. Energy, Utilities, and Financial Services remain the strongest sectors, with Healthcare, Consumer Cyclicals, Defensives, and Real Estate the weakest. This resembles the expectations and risks associated with higher bond yields.
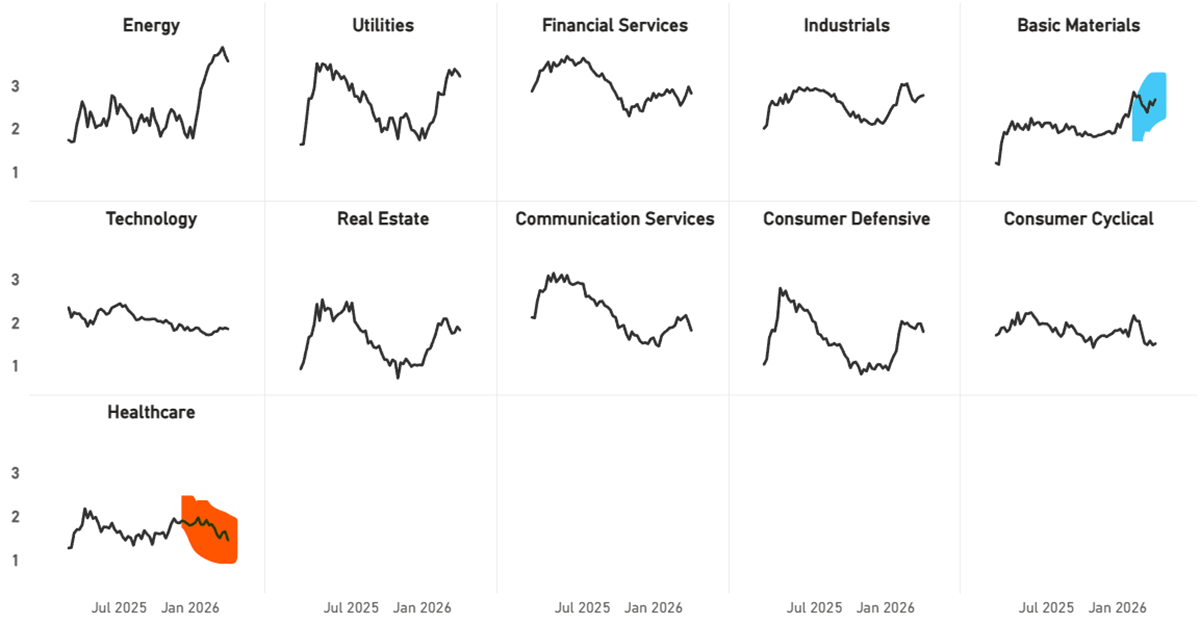
Industry Trend Changes in CAPR
There has been no material change in sectors, but Basic Materials are back, while Healthcare continues to be derated. Energy was weak until Friday, but it has opened strongly this morning.
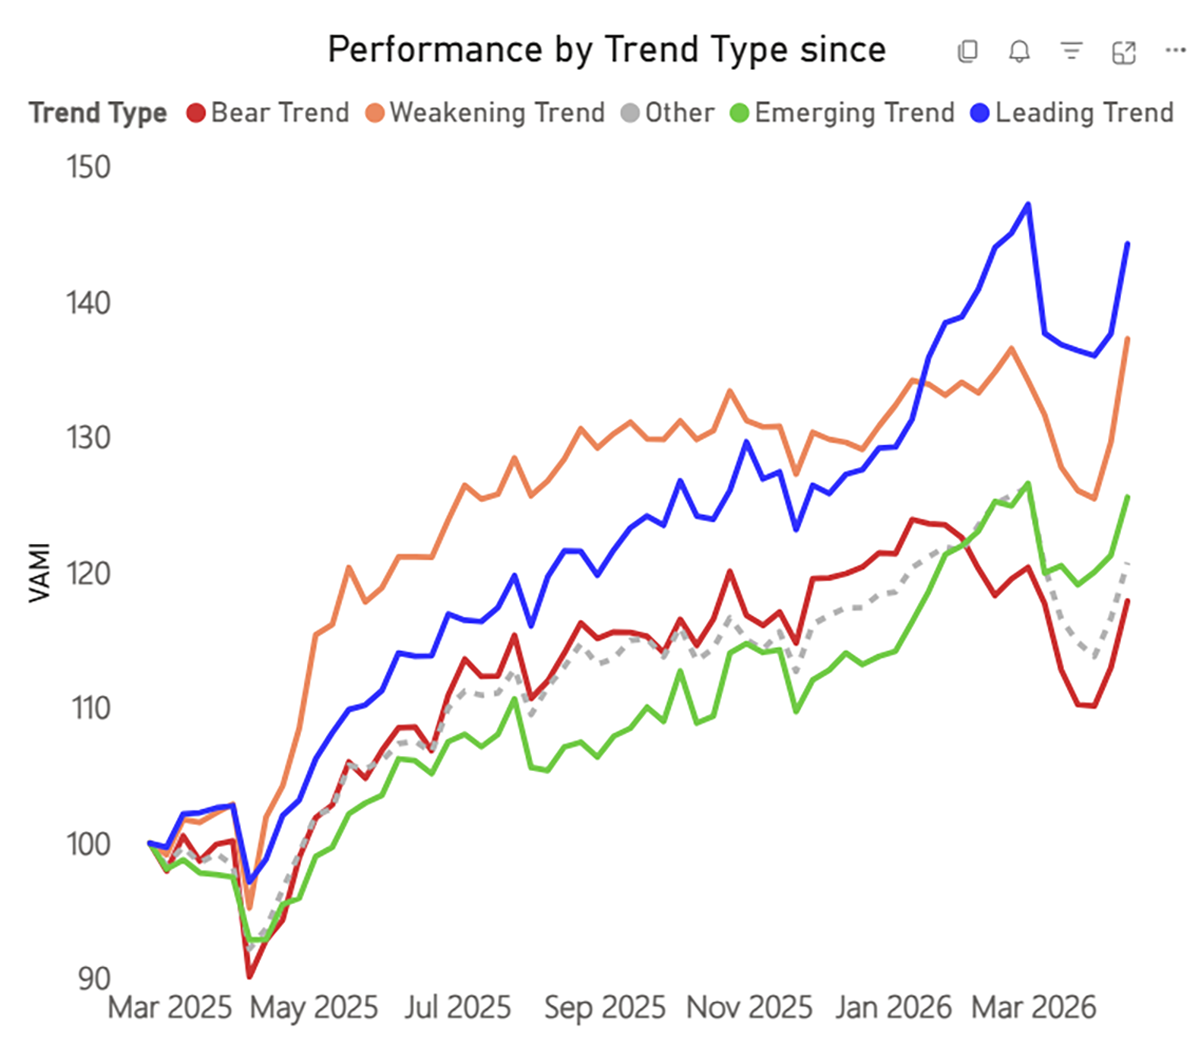
Trend Type Performance
The recovery has been broad, with the best performance from weakening and bear trends, which are oversold. I wouldn’t classify this as so much of a momentum crash as a lift across the board. The strength of the move implies considerable short positions had built up.
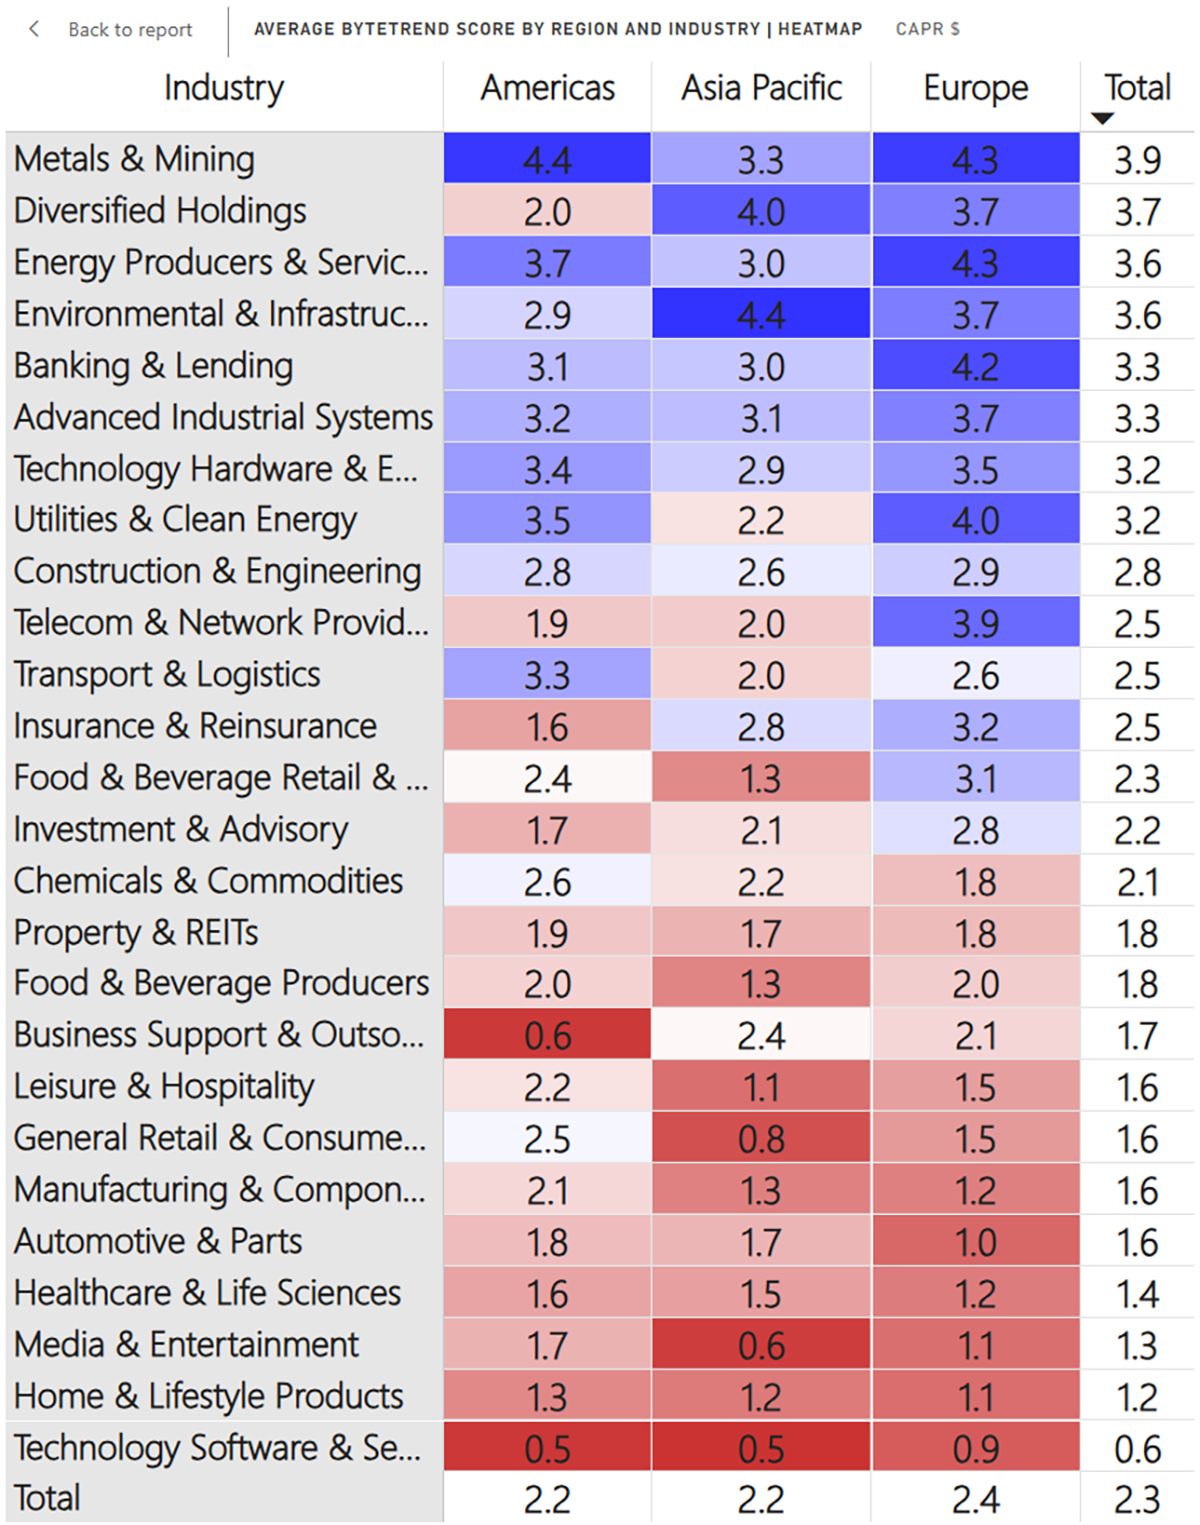
Regions and Industries Average CAPR Score
Metals are back in front with the highest group score. Utilities and Clean Energy have held up with old energy. Banks have also proved to be resilient. The Consumer, Health, and Software remain troubled. Food & Beverage has also improved significantly.
Read the full update on our website: